Download a PDF copy of the Lighthouse Wealth Management Outlook: July 2025
The Buck Stops Where?
In 1945, while visiting a federal reformatory in Oklahoma, Fred Canfil, a United States Marshal, saw a sign that piqued his interest. At his request, the warden ordered a similar sign that was mailed to the White House. For the next seven years, visitors to the Oval Office would be greeted by these words on Harry S. Truman’s desk: “The Buck Stops Here.” Truman adopted the phrase as his personal credo that, as President, he did not “pass the buck.”
Today, however, we’re not so interested in the question of passing the buck, but rather where the buck is going to stop and why it’s moved so far in the first place. Against a basket of foreign currencies, the U.S. dollar has fallen nearly 11% in the past six months—its worst start to a year since 1973.
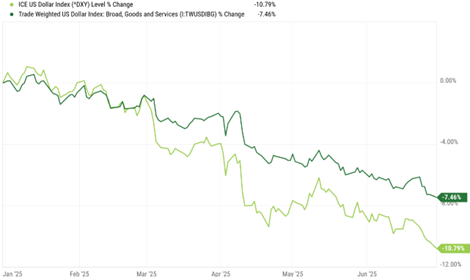
Source: YCharts
The bond market may offer a few clues to solving the mystery. In the wake of Moody’s Investors Service downgrade of the United States’ credit rating from Aaa to Aa1 in May, and amid deficit concerns surrounding the “Big Beautiful Bill,” some experts have suggested that the “bond vigilantes” have returned, demanding a higher premium to hold Treasurys.
The “vigilante” theory sounds plausible, but identifying the vigilantes is another matter. Neither inflation expectations nor inflation-adjusted bond yields have climbed materially since the start of the year, so the dislike for Treasurys doesn’t seem terribly elevated. Moreover, if we look overseas, we find that foreigners have record-high exposure to long-dated U.S. government bonds.
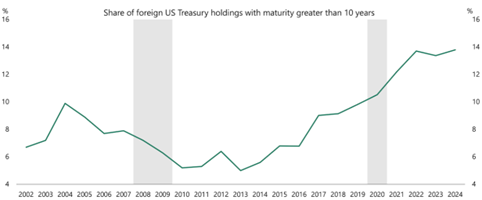
Source: Apollo Chief Economist
As we noted in our April 2025 newsletter, U.S. dollar-denominated assets (mostly government bonds) account for roughly 60% of total foreign exchange reserves. Euro-denominated assets hold a share of approximately 20%. However, governments and central banks do not hold all their reserves in the form of bonds and other securities.
According to consultancy Metals Focus, central banks worldwide are on track to buy 1,000 metric tons of gold in 2025, continuing an accumulation trend that spiked in 2023 as the COVID pandemic subsided. Central banks are currently the third-largest gold buyers, after the jewelry sector and physical investment. Since 2023, gold has risen from 14% of total global reserves to a 23% share. In the same period, the dollar’s share of reserves has declined from 50% to about 44%.
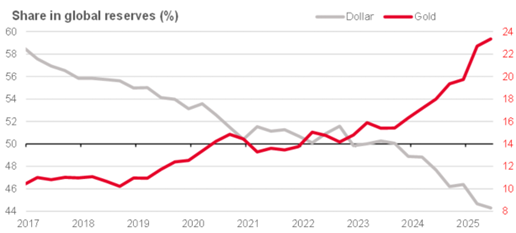
Source: Société Générale S.A.
As central banks have swapped their dollars for gold, the precious metal’s price has risen accordingly. Gold rose over 13% in 2023, spiked 27% in 2024, and is up about 25% so far in 2025—its best start to a year since 1979. In the context of this de-dollarization of central bank reserves, perhaps the best way of answering the question, “Where does the buck stop?” is to instead ask, “How pricey will gold get?”
Financial Market Review
Stocks began the quarter with a significant double-digit decline following the new tariff announcements. However, the initial market reaction softened as implementation deadlines were extended and corporate earnings surpassed expectations. After bottoming the second week of April, stock prices spent most of the quarter grinding steadily higher, finishing the quarter up nearly 11%. Foreign shares posted a comparable return, with developed market indexes up 11% to 12% for Q2.
In dollar terms, foreign stocks (up 18% to 20%) outperformed U.S. stocks (up 6%) by the most in the first six months of a year since 1993. Much of the foreign outperformance was due to falling U.S. dollar effects. The ICE U.S. dollar Index (which measures the greenback against six major currencies) was down 7.1% in the quarter; the broader trade-weighted U.S. dollar index fell 5.6%. Conversely, the Swiss franc, euro and British pound rose 11.4%, 8.4% and 6.4%, respectively, against the U.S. dollar in Q2.
Technology was the best-performing U.S. stock sector in Q2, up nearly 23%. Six of the “Magnificent Seven” stocks posted double-digit returns; Apple was a notable laggard, losing 7.5% in the quarter. Year to date, only three of the Seven—Microsoft, Nvidia and Meta—are in positive territory as Tesla’s shares have cratered and concerns remain about Apple’s and Alphabet’s position in the Artificial Intelligence (AI) race.
Growth stocks substantially outperformed value stocks across all market capitalizations (up by about 6% in small-caps and 12% in mid- and large-caps). All stock sectors, save two, posted positive quarterly returns. Energy and Health Care lost 8.5% and 7.2%, respectively, as lower crude oil prices and the prospect of lower Medicaid reimbursements hurt performance.
Barring long-duration securities, all bond sectors posted modest positive total returns in the quarter as short- and intermediate-term Treasury yields finished where they started. The Bloomberg U.S. Aggregate Index was up 1.21%. Junk bonds were the best sector performer, returning 3.5% to 4.0%. Intermediate-term investment grade corporates generated returns in the 2.7% to 2.8% range. Long-term Treasury bonds were the worst performer as 30-year yields rose about +0.40% in Q2.
The Bloomberg Commodity Index fell 3.1% during the quarter, with crude oil declining 7.8%. In addition to gold’s growth momentum discussed previously, silver also continued an upward trend, rising over 8%. Silver is up about 24% YTD, its best first-half performance since 2016.
Economic Conditions
U.S. gross domestic product (GDP) was revised downward in late June to -0.5%, down from a previous estimate of -0.2%. (This represents the first quarterly contraction in three years.) The update was primarily driven by downward revisions to consumer spending and exports. The Atlanta Fed’s GDPNow model forecast for Q2 GDP growth is 2.6%.
The Consumer Price Index (CPI) rose 0.3% in June, putting the 12-month inflation rate at 2.7%. Core CPI (which excludes food and energy) was up 2.9% year-over-year. As inflation metrics remain above the Fed’s 2% target, no rate cut is expected at its July 30th meeting. The dollar’s decline, tariffs and immigration restrictions are all exerting upward pressure on inflation, although the tariff effects have been mitigated to date as companies stocked up on imports before they were imposed.
The Federal Reserve held short-term interest rates steady at a 4.25% to 4.5% target at its June meeting. The Fed expects both inflation and unemployment to rise by year end. Fed officials predict two interest rate cuts by the end of 2025, although Fed Chairman Powell indicated that the Fed is waiting “to understand what will happen with the tariff inflation” before cuts begin. The Fed hasn’t moved rates since December 2024.
While the Fed Funds rate has remained stable in 2025, the Fed has significantly slowed down its quantitative tightening program from $25 billion per month to just $5 billion per month, starting in April, representing a more cautious approach. Impatient with current interest rate levels, President Trump has repeatedly called for Powell’s resignation. Powell’s term as chair is set to expire in May 2026, and he hasn’t indicated any intention of stepping down prior to then.
The economy added a stronger-than-expected 147,000 jobs in June as the unemployment rate ticked down to 4.1% from 4.2%. However, the vast majority of the month’s gains were limited to a few industries: healthcare (58,600), leisure and hospitality (20,000) and state and local government (80,000). Although layoff activity has remained relatively low and wage growth solid, the labor market may be weaker than those metrics would indicate.
The business/establishment survey showed that the U.S. added about 1.7 million jobs over the 12 months ended in May, but the household survey shows a much smaller gain of 1.0 million jobs. Automatic Data Processing (ADP) data indicates that smaller companies have greatly reduced hiring in 2025. Companies with fewer than 50 employees have added an average of only 5,300 jobs per month 2025; last year’s pace was 40,000 per month.
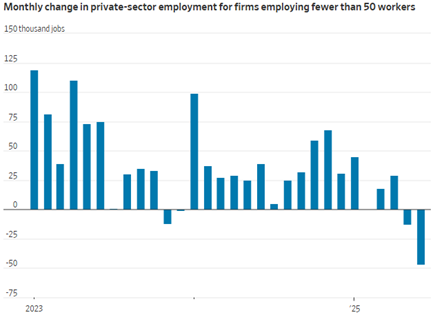
Source: The Wall Street Journal, ADP
June employment figures revealed a sour data point. For the first time in its 45-year history, the unemployment rate for recent college graduates (5.8%) exceeded the national level. Historically, college graduates have fared better than the overall workforce. While hard data on the causation has yet to emerge, anecdotal evidence strongly indicates that implementation of AI is automating much of the entry-level work that has historically been performed by new graduates.
Historical Unemployment Levels
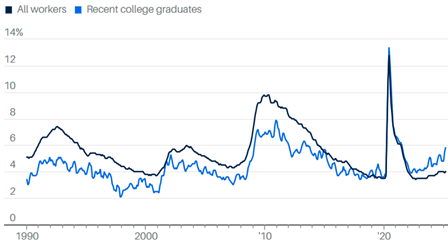
Source: Census Bureau, Labor Department
Asset Class & Sector Survey
Despite the continuing uncertainty of adverse tariff and immigration policy effects, the economy appears set for modest growth through the rest of 2025, as AI adoption powers productivity improvements. Consensus GDP estimates have improved modestly as tariff deadlines have been postponed and modified; most forecasts are in the 2% to 3% range for the full year.
We can’t help but observe a material disconnect between modest projections for economic growth and the roaring earnings projections made by equity analysts. For the full year 2024, the S&P 500 Index generated trailing earnings of $210.81. Forward (FY 2026) estimates for the Index from S&P Global and Goldman Sachs are in the $274 to $280 range, implying a massive compounded 14% annual earnings growth for the next two years.
We recently reviewed annual earnings data for the S&P 500 going back to 1988. Whether you consider 5-, 10-, 15- or 20-year periods, U.S. corporate earnings have averaged 6% to 7% annual growth. Five-year compounded earnings growth was below 10% more than three-quarters of the time. Individual years of extraordinary earnings growth—as is currently being forecast—were nearly always immediately preceded by a year or two of extremely negative growth. There were two notable exceptions:
- 2004 – 2006 – The housing bubble—earnings did not reach a new high until 2011
- 1994 – 1996 – Internet adoption, pre-dot-com bubble
Periods of exceptional growth were always precipitated by at least one of four factors:
- Rebounds from recessionary / low-earnings periods
- Large-scale capital misallocations leading to unsustainable structures of production
- Large-scale money creation / inflation, initiated by the Federal Reserve
- New technologies leading to rapid productivity growth
Today, only the latter factor offers a meaningful potential boost to corporate earnings. As we have previously noted, the efficiency gains afforded by AI will certainly be reflected in company bottom lines for the next few years. At a valuation of 30 times trailing earnings and 23 times forward earnings, the U.S. stock market is banking on it—maybe too much.
Please reach out to us if you would like to discuss capital markets or your personal financial plan.
 Teancum D. Light, JD, CPA, CFP®
President

Chief Investment Officer
Disclosures: This material is for informational purposes only and is not rendering or offering to render personalized investment advice or financial planning. This is neither a solicitation nor a recommendation to purchase or sell an investment and should not be relied upon as such. Before taking any action, you should always seek the assistance of a professional who knows your particular situation for advice on taxes, your investments, the law or any other matters that affect you or your business. Although Lighthouse Wealth Management has made every reasonable effort to ensure that the information provided is accurate, Lighthouse Wealth Management makes no warranties, expressed or implied, on the information provided. The reader assumes all responsibility for the use of such information.