Download a PDF copy of the Lighthouse Wealth Management Outlook: January 2025
Finance, it is often said, has “physics envy.” As a scientific discipline, physics has well-established laws that lend themselves to mathematical modeling and a robust capacity for prediction. A prime example is Newton’s first law of motion: “An object will not change its motion unless a force acts on it.” Another illustration: “Matter can’t be created or destroyed, only converted from one form to another.”
Whereas the physical laws of nature exist independent of human observation and interaction, finance has no intrinsic laws. The best that the discipline can offer is a set of observations, or rules, that hold more often than not. But whereas no one can circumvent the laws of physics (cue Star Trek’s Enterprise engineer, Mr. Scott), many “rules” of finance are broken with some regularity. 2024 offered several cases in point.
Rule #1: Asset allocation, not security selection, accounts for the majority of portfolio returns.
The S&P 500 Index returned 25% in 2024, a blistering gain. Tempting though it is to say that this reflected the return of an “asset allocation” to U.S. large-cap stocks, more than half of the S&P’s gain was due to the “Magnificent Seven,” which constitute the largest companies in the Index. An equal-weighted U.S. large-cap stock index returned less than 13% last year. And an S&P 500 Index portfolio that held none of the Seven would have returned a middling 6%.
What superficially appears as an asset allocation decision—“What’s our target weight for large-cap U.S. equity?”—has largely become a wager on how big Meta, Nvidia, Alphabet, Apple, Amazon, Tesla and Microsoft will grow.
Rule #2: Recessions follow an inverted yield curve.
Whenever the yield on the two-year Treasury note has exceeded the yield on the 10-year Treasury note, a recession has nearly always followed within 6 to 24 months. Such a “curve inversion” has predicted every recession since 1955, with only one false signal during that time.
The curve first inverted in July of 2022, then went on to set a new record for “Longest Yield Curve Inversion in U.S. History” in March of 2024. After another seven months, it finally un-inverted last September. However, a recession still has yet to materialize.
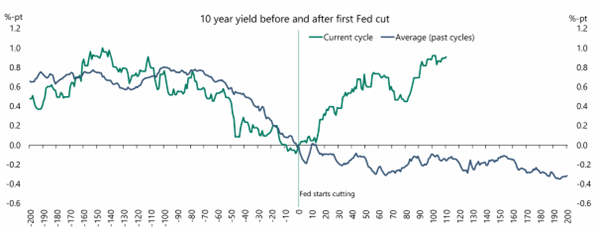
Rule #3: When the Federal Reserve starts cutting short-term interest rates, intermediate- and long-term interest rates also move downward.
Part of the reason the yield curve has been such a strong prediction of recession is that it signals a future interest-rate-cutting cycle by the Federal Reserve. Generally speaking, the Fed lowers interest rates as it anticipates recessionary conditions. As those conditions unfold, intermediate-term Treasury bonds look more attractive due to their higher yields in a less economically stable environment.
Since September, the Fed has cut interest rates by 1%. But, in a highly unusual move, yields on 10-year Treasury notes have spiked by more than that amount.

Source: Apollo Chief Economist
Financial Market Review
For the fifth consecutive quarter, the S&P 500 posted a positive return, generating 2.4%. For the full year, the S&P 500 Index was up 25%, with the “Magnificent Seven” stocks accounting for more than half of that total gain. After rising 24% in 2023, the back-to-back gains of over 20% mark the best performance for the S&P 500 since 1997 and 1998.
Large- and mid-cap growth stocks posted returns of 7% and 8%, respectively, for the quarter. Value indexes were down 1% to 2% across all market capitalizations. Foreign shares declined rather significantly. Developed Markets indexes were off by 7.5% to 8.5% in Q4, while Emerging Markets were down 7%. For all of 2024, major Developed Market indexes returned 3.5 to 5.5%, with Emerging Markets up about 7%.
Sector performance was widely dispersed in Q4, with four of the S&P sectors rising and seven posting negative returns. Consumer discretionary shares (the top performer) climbed 12% in the quarter, while materials (the worst performer) fell by the same amount. For the full year, communications services posted the best return (nearly 35%), followed by financial services (30%) and consumer discretionary (26%).
Bond prices were hit during the quarter as intermediate- and long-term interest rates rose considerably after the Fed’s mid-September meeting and before November election results. Higher yields were the result of both rising “real rates” as well as higher expected inflation. The Barclays U.S. Aggregate Bond Index lost 3.1% in the quarter. Only very short-term bonds posted a positive return. For the full year, the Index returned just 1.25%.
The “higher-for-longer” interest rate outlook and a comparatively strong economic outlook for the U.S. boosted the dollar against every major currency in Q4. The greenback was up 5.5% against the euro and 11% versus the yen in 2024.
Higher interest rates also weighed on commodity prices late in the year. The Bloomberg Commodity Index was down 1.6% during the quarter, with gold flat and silver down more than 7%. Oil prices rose to end the year in the low $70s, about where they started in 2024. For the full year, the Bloomberg Commodity Index was up 5.4%, with gold (27%) and silver (21%) driving much of the gain.
Economic Conditions
Real GDP grew at a 3.1% annualized rate in Q3, up slightly from 3.0% in the first quarter. Housing data was mixed, as construction starts remained sluggish, but existing home sales surprised to the upside. The U.S. economy outperformed expectations for a second consecutive year, with GDP growth likely to be around 3% for the full-year in 2024 compared to an initial consensus estimate of 1.3%. The Atlanta Fed’s GDPNow model estimate for Q4 growth is 2.7%.
The national unemployment rate rose gradually in 2024, from 3.7% in January to 4.1% in December. The hiring rate fell from 3.7% at the end of 2023 to 3.3% at the end of 2024. Weekly unemployment claims hit their lowest level since April during the last week of the year. However, the robust headline unemployment numbers belie a weakening labor market.
Economists largely believe the continued low number of weekly jobless claims, combined with relatively steady continuing claims, reflect a “low hire, low fire” type of labor market. Although Americans aren’t losing many jobs, it’s becoming increasingly harder to find them. On average, it now takes unemployed people about six months to find a job, roughly a month longer than it did during the post-pandemic hiring boom in early 2023. There is now about one job posting per unemployed worker, down from two in early 2022.
Much of the pain is concentrated in high-paying white-collar jobs, including in tech, law and media, where businesses grew fast when the economy reopened from the pandemic. Strong hiring has since narrowed to a smaller number of industries. Notably, healthcare and government work have been responsible for more than half of overall job creation over the past 12 months.
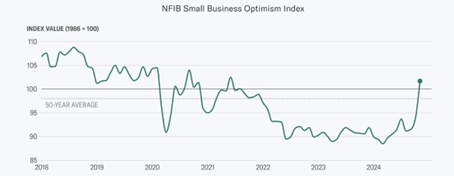
The NFIB’s Small Business Optimism Index surged dramatically in November, riding the post-election optimism over Donald Trump’s incoming presidency to post the biggest monthly gain since 1980. The index is correlated with politics, due to the link between Republican leadership, loose regulatory environments and lower taxes, which drive small business morale.

Source: NFIB
The NFIB release says that small businesses expect a “repeat performance” of President-elect Trump’s subdued first-term inflation rate, although few economists expect it amid plans for tariffs, tax cuts and other inflationary policies. The incoming president has promised tariffs on imports from China, Canada, Mexico and other countries. He also intends to shrink the labor pool by reducing migration. Higher tariffs and reduced immigration are both likely to pressure inflation upwards.
The inflation rate increased modestly in the fourth quarter. The Consumer Price Index (CPI) rose 2.6% in October, 2.7% in November and 2.9% in December. Core CPI increased 3.3% in both October and November and 3.2% in December. Despite the softening labor market, annual wage growth was 3.9% in December. Bond markets have begun projecting annualized five-year inflation in the 2.5% range, up from 1.9% in early September.
The Fed has reduced interest rates by a collective 1.0% since it began cutting in September. But the recent acceleration of realized and expected inflation, combined with strong economic momentum, caused the Federal Reserve to adjust its 2025 rate cut projection downward, from four 0.25% cuts to only two. The Fed’s economic forecast cited less concern about the labor market and more uncertainty around inflation.
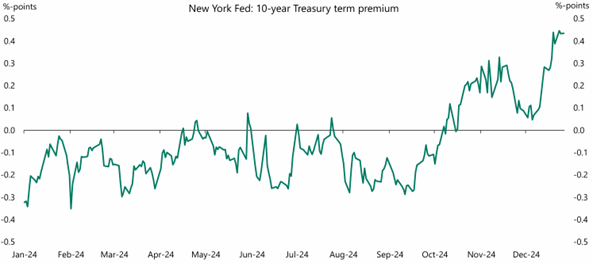
The recent surge in 10-year Treasury note yields reflects not only rising inflation expectations, but about 0.50% of higher “real rates,” likely due to higher expected federal debt issuance. (We discussed real rates in our October 2024 newsletter – https://lighthousewealth.com/blog/outlook-october-2024/.)
This “term premium” reflects the yield demanded by intermediate-term bond investors in addition to what they would expect to earn from short-term Treasury bills. As the graph below depicts, it has risen by 0.75% since September.
A rising “term premium” for Treasury notes likely reflects concerns about U.S. fiscal sustainability.

Source: Apollo Chief Economist
Asset Class & Sector Survey
Barring a large catastrophic event, such as war, major earthquake, etc., we expect three primary drivers of investment returns over the next 12 to 36 months:
- Intermediate-term interest rates
- Elevated starting stock valuations
- Magnificent Seven performance
Trump’s tariff and immigration policies could stoke inflation, forcing the Fed to further postpone rate cuts—and perhaps even raise rates—in 2025. Any further increase in the level of interest rates and/or the duration of higher rates would produce two notable effects: 1) higher borrowing costs for businesses, generally reducing earnings for non-mega-cap companies, and 2) downward pressure on stock prices.
Regardless of the direction and level of rates, the intermediate-term (5 to 10 year) outlook for stocks (broadly speaking) is rather anemic. At 22x, the S&P 500’s forward price/earnings (P/E) ratio sits firmly in its highest historical quintile. At these starting valuations, investing in the S&P 500 has historically yielded an average annualized return of only 2% over 5- and 10-year periods. Vanguard forecasts just a 2.8% to 4.8% annual return for the S&P 500 over the next 10 years, while Goldman Sachs estimates 3% for that horizon. JPMorgan is comparatively sanguine, projecting a 10-year return of 5.7% over the next decade.
Of course, these dour, history- or statistically-driven stock market forecasts are unlikely to materialize if the “Magnificent Seven” can continue to earn their nickname via continued high levels of sales growth and profit margins. At some point, those numbers will inevitably revert to the mean (and stock prices will consequently fall), but when and how hard is anyone’s guess.
Rather than speculate on the trajectory of the mega-cap names, we are inclined simply to market-weight them in portfolios. The remainder of our asset allocation decision is focused on maintaining reduced international stock exposure and opportunistically shifting from cash to bonds when the latter offers a sufficiently large term premium.
We also find private corporate credit a particularly compelling alternative to virtually all non-Magnificent-Seven assets. In addition to offering 9% to 10% yields, the value of the loans held in those funds is virtually unaffected by the interest-rate volatility which has weighed on bond prices of late.
Please reach out to us if you would like to discuss capital markets or your personal financial plan.
 Teancum D. Light, JD, CPA, CFP®
President
Chief Investment Officer
Disclosures: This material is for informational purposes only and is not rendering or offering to render personalized investment advice or financial planning. This is neither a solicitation nor a recommendation to purchase or sell an investment and should not be relied upon as such. Before taking any action, you should always seek the assistance of a professional who knows your particular situation for advice on taxes, your investments, the law or any other matters that affect you or your business. Although Lighthouse Wealth Management has made every reasonable effort to ensure that the information provided is accurate, Lighthouse Wealth Management makes no warranties, expressed or implied, on the information provided. The reader assumes all responsibility for the use of such information.


