To download the PDF copy, click here: Lighthouse Wealth Management Outlook: January 2026
“Silver Linings and Fiscal Clouds”
For the third consecutive year, the dominant financial narrative remained an AI-driven bull market in stocks. While the nearly 18% return of the S&P 500 Index is impressive, the best-performing asset classes of 2025 weren’t even American securities. As the dollar depreciated against all major currencies (12% against the euro), both Developed International and Emerging Markets stock indexes outpaced the S&P by double-digit margins. More notable was the performance of precious metals. Gold was up 64%; palladium and platinum were up 78% and 127%, respectively. But silver took the 2025 spotlight with a staggering 145% return.
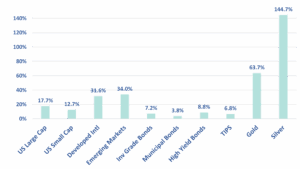
Silver’s massive surge was driven by several factors, including a rapid expansion of solar energy facilities and a doubling of silver content in electric vehicles. In addition to the industrial demand, speculators began to appreciate that silver’s price was well below its historical ratio to gold, which had run up considerably in recent years.
As we noted in our July 2025 Outlook, central banks have been on a buying spree for gold reserves since 2022. That trend has continued, with retail investors around the world joining the precious metals party. Notably, inflows into gold exchange-traded funds (ETFs) in India were nearly $4.0 billion in 2025—triple their 2024 levels.
In what may be a related development, a year ago, long-term interest rates started drifting higher than what would have been predicted by short-term interest rates. Historically, the decline of short-term rates in a Federal Reserve cutting cycle has been met by a downward move (albeit smaller) in 10-year bond yields. However, the pattern hasn’t been as strong this time around.
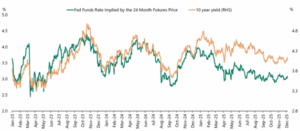
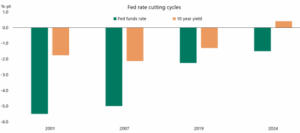
Source: Apollo Chief Economist
So, what’s different for longer-term bonds in this cycle? The increasingly vulnerable federal fiscal position may account for at least part of the explanation. The United States federal debt-to-GDP ratio is currently around 124%, with total debt held by the public in the 94% range. The former number is slightly below the record touched during the COVID recession of 2020; the latter record was touched in 1946, with a raft of bond issuance having financed World War II. In all probability, both records will be surpassed in a few years.
Compounding the issue is the accelerating insolvency of the Social Security Trust Fund. Recent projections have pulled the “day of reckoning” forward to 2033. At that point, the program’s revenue will cover only about three-quarters of scheduled benefits. (Congress could temporarily use disability fund money to prop up the retirement fund, but on a combined basis, the two funds face total insolvency by early 2034.)
Hedge fund mogul Ray Dalio has long warned that the U.S. is in the late stages of a “Big Debt Cycle,” where the Treasury is forced to borrow just to pay the interest on existing obligations. His concerns were recently corroborated by former Fed chair Janet Yellen, who said that rising debt levels and political pressure have created the risk of “fiscal dominance” taking hold in the U.S.
Yellen contends that the Fed may be “pressured, implicitly or explicitly, to keep interest rates lower than warranted by macroeconomic conditions.” That is, the Fed’s mandate to keep a lid on inflation may be overrun by the Treasury’s need to keep down borrowing costs. In so many words, the Fed has to print money to buy Uncle Sam’s debts.
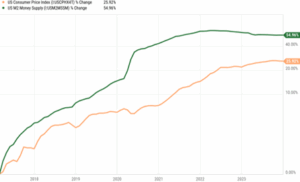
History is certainly on Yellen’s side of the argument. In both the World War II/Korean War era and during COVID, the Treasury borrowed to fund massive deficits and the Fed obliged in kind, substantially increasing the money supply. As the Treasury ran double-digit deficits as a percent of GDP in 2020 – 2021, the Fed stepped into the breach and printed $4 trillion in digital dollars.
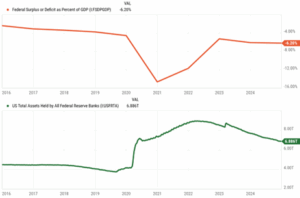
Source: YCharts
“Real” yields on inflation-adjusted 30-year Treasury bonds recently hit 2.6%—their highest level since 2010—reflecting the risk of rising federal debt issuance. But the bond market appears largely indifferent to the potential inflation risks. Today, the modest differential between nominal Treasury yields and Inflation-Protected Securities (TIPS) yields is signaling a mere 2.3% annualized CPI over 5-year and 10-year horizons.
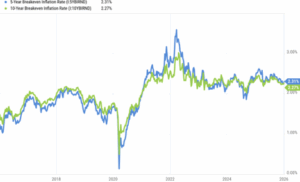
It’s wishful thinking, in our view. At the time when the massive COVID bailouts started in March 2020, the bond market (as measured by nominal yields versus TIPS yields) was predicting cumulative inflation of only 3% over a five-year horizon. With the benefit of hindsight, it was off by over 20%.
The rise in “real” 30-year bond yields and the increasing preference of both institutional and individual investors for precious metals over long-term Treasurys heralds the end of a long era of passive Treasury debt absorption. Over the next decade, fiscal realities will force Uncle Sam into some combination of spending reductions, tax increases and currency devaluation. Historically, the latter has been the least painful course for politicians—and, therefore, the most likely to be realized.
If you would prefer not to be the one stuck paying a hefty “inflation tax” in a few years, we’d advise steering clear of long-term bonds.
Financial Market Review
Stock markets continued their Q3 rally into the final quarter of 2025, as the S&P 500 Index returned 2.7%. Value stocks outperformed growth shares in both the large-, mid- and small-cap spaces. International shares surged, with the EAFE Index up 4.7%. The U.S. dollar staged a 2% mid-quarter rally versus a basket of foreign currencies, before finishing roughly where it began the quarter.
We note that the overwhelming majority of 2025 stock returns within the Eurozone were driven by multiple expansion and currency movements, not the fundamentals of earnings growth and dividends. In contrast, about 12% of the U.S.’s nearly 18% return last year was driven by higher per-share earnings.
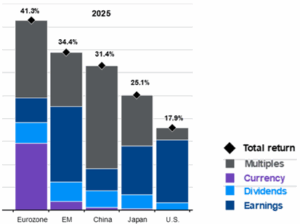
Source: JP Morgan
Alphabet (28.8%) was the biggest gainer within the Magnificent Seven in the wake of favorable court rulings and a strong rollout of its new Gemini AI platform. Healthcare was the strongest sector performer (11.7%), bringing its 2025 return up to 14.5%. Barring that move, sector performances were rather muted. Technology and Financials were up 2.3% and 2.0%, respectively. Real Estate was down 3.2%. For the year, the Seven accounted for approximately 40% of the S&P 500’s overall performance.
The Bloomberg Commodity Index rose 4.8% for the quarter; precious metals surged. Gold was up more than 11%; platinum rose 30%. Silver was up an astounding 52%. Crude oil continued its downward move, as West Texas Intermediate dipped below $60/barrel. For the full year, the commodity index finished up 11.1%.
Most bond sectors generated positive returns in Q4. The Barclays Aggregate Index returned 0.94%, with mortgages returning 1.5% and investment-grade corporates 1.2%. Junk bonds and bank loans posted returns in the 1-2% range. Credit spreads remain slightly above their multi-decade lows. Notably, long-maturity Treasury bonds posted a negative return for the quarter as 30-year yields rose a modest 0.12%.
Economic Conditions
The economy grew at a robust 4.3% annualized rate in Q3 2025, the largest quarterly GDP increase since Q3 2023. Resilient consumer spending (3.5% YoY) was the biggest contributor, with rising healthcare spending accounting for 18% of the total expansion. A post-tariff implementation surge in exports and decrease in imports provided an additional boost. Overall business investment growth slowed to 2.8% in Q3 (down from 7.3% last quarter).
Much of the GDP gain was driven by higher labor productivity, which surged to a 4.9% annualized rate in Q3. Output rose 5.4%, while hours worked increased only slightly (0.5%), leading to a drop in unit labor costs. This robust growth reflects businesses’ ability to produce more goods and services in a weak hiring environment.
Headline unemployment was 4.4% in December after hitting a four-year high of 4.6% in November. The labor market is entering 2026 in a “low-hire, low-fire” state. The “quits rate” dropped to 2.0% (the lowest since 2020), while total planned hiring for 2025 was down 34% versus 2024, reaching its lowest level since 2010. Healthcare accounted for nearly half of all job growth in 2025.
The Consumer Price Index (CPI) rose 2.7% year-over-year in December, unchanged from November. Core CPI came in at 2.6%, the lowest reading since early 2021. September Personal Consumption Expenditure (PCE) numbers were slightly higher, at 2.8% for both headline and core metrics.
For the third time in as many months, the Federal Reserve cut the fed funds rate by 0.25% in December, setting its target range at 3.50%–3.75%. The Fed’s “dot plot” median projection is for only one 0.25% rate cut for all of 2026. However, the plot reveals a massive dispersion of views, signaling a breakdown in consensus. For its part, the market is currently pricing in 0.50–0.75% of rate cuts this year. Markets currently see the “floor” for this cycle at approximately 3.1%, reached in early 2027.
The biggest uncertainty regarding monetary policy is the expiration of Jerome Powell’s term as Fed chairman in May of this year. Markets are currently pricing in an 80% probability that Kevin Hassett (a known advocate for lower rates) will be the nominee to replace him. This expectation of a “Trump-era Fed” is likely why futures markets are pricing in more rate cuts than the current Powell-led committee is signaling.
President Trump’s push for easier monetary policy had been limited to criticisms and personal insults of Fed Chairman Jerome Powell. However, the stakes were severely raised last week as the Justice Department served the Fed with subpoenas and threatened Powell with criminal indictment related to his Senate testimony last June. The official concern is the cost of the Fed’s renovation of two office buildings; Mr. Powell maintains that the move is a “pretext” to undermine the Fed’s rate-setting independence.
Asset Class & Sector Survey
The latest FactSet projections (Jan. 9th) project that S&P 500 companies will report quarterly earnings growth of 8.3% versus last year on a 7.7% revenue increase. The Information Technology sector leads all ten S&P sectors (25.9%). Energy is the only sector that will report a YoY earnings decline.
The Magnificent Seven, which account for about a third of the S&P 500’s market cap, should generate earnings growth of 22% in 2025. The “Other 493” are expected to produce 9% earnings growth, resulting in a 12% growth rate for the S&P 500 index as a whole. Sales rose by 7% for companies in the Index as margins increased by 5.3%. At 12.9%, the S&P 500 had its highest annual margin since FactSet began tracking the metric in 2008. Among sectors, Information Technology also leads (28.5% in Q4).
For the full year 2026, FactSet’s bottom-up S&P 500 revenue and earnings estimates are 7.3% and 14.9%, respectively. Goldman Sachs projects comparable figures of 7% and 12%. Given reduced trade war uncertainty, easier monetary conditions, a weaker dollar, AI-driven productivity gains and accelerated depreciation benefits of the “One Big Beautiful Bill,” these projections, while high, seem attainable given recent trends.
Stretched valuations serve as a mild pessimistic offset to the favorable earnings outlook. The S&P 500 enters 2026 with a forward P/E ratio of 22.2 —11% above its five-year average and 19% above its ten-year averages (per FactSet). Around half of the valuation metrics for the S&P 500 tracked by Bank of America are higher than levels seen in March 2000, as the dot-com bubble began to burst. But in the “likely higher earnings versus possible lower valuations” stock price tug-of-war, we are inclined to bet on the former in 2026. As expressed in our introductory paragraphs, the bet we’re most wary of making right now is on long-term bonds.
Please reach out to us if you would like to discuss capital markets or your personal financial plan.

Teancum D. Light, JD, CPA, CFP®
President

Chief Investment Officer
Disclosures: This material is for informational purposes only and is not rendering or offering to render personalized investment advice or financial planning. This is neither a solicitation nor a recommendation to purchase or sell an investment and should not be relied upon as such. Before taking any action, you should always seek the assistance of a professional who knows your particular situation for advice on taxes, your investments, the law or any other matters that affect you or your business. Although Lighthouse Wealth Management has made every reasonable effort to ensure that the information provided is accurate, Lighthouse Wealth Management makes no warranties, expressed or implied, on the information provided. The reader assumes all responsibility for the use of such information.