Download a PDF copy of the Lighthouse Wealth Management Outlook: October 2024
In 1896, American economist Irving Fisher proposed the concept of a “real” interest rate. Although the stated, or nominal, rate of interest is what a borrower is contractually obligated to pay a creditor, Fisher argued the nominal rate does not reflect the return to the lender after subtracting the cost of inflation. Rather, the “real” rate earned by the lender equals the nominal rate minus an expected inflation rate. For example, a five-year loan at a 5% nominal interest rate and an expected 3% annual inflation rate would be expected to earn a real interest rate of 2% (5% – 3% = 2%).
As real interest rates decrease, the demand for loans displays a corresponding increase as the cheaper financing costs make a wide array of goods and services more attractive to businesses and consumers alike. By adjusting the real interest rate, central banks can thus affect the demand for credit and, in turn, the demand for products purchased on credit (which is to say, a huge swath of the economy).
In their efforts to stimulate credit demand in the wake of the Global Financial Crisis of 2008 and the COVID pandemic, the Federal Reserve and other major central banks kept real interest rates at exceptionally low—even negative—levels. Indeed, since January 1, 2010, the real interest rate on Treasury bonds maturing in five years has been a measly 0.01%.
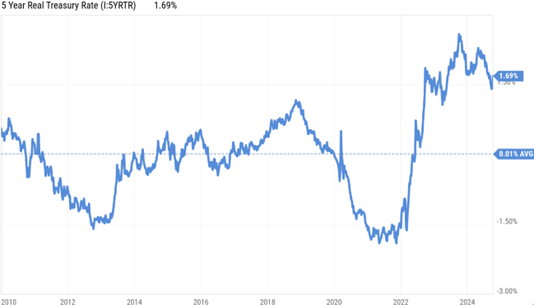
Source: YCharts
As inflation surged in the wake of massive money creation during the COVID pandemic, the Fed sharply reversed course in mid-2022 and embarked on a campaign of interest rate hikes. Intermediate-term real interest rates surged from levels below 1% to north of 2%. Economic theory and history would both predict that an attendant decrease in loan demand would result in a cascade of production declines spreading from one industry to another—i.e., a recession. But some funny things happened on the way to the slowdown.
For one, Uncle Sam has continued to borrow and spend at a tremendous pace. The federal deficit is projected to be 6.5% of Gross Domestic Product (GDP) this year, up from 6.3% last year and 5.4% in 2022. These figures are more consistent with a recession or wartime spending, not those of an economic boom.
Second, growth has been boosted by massive spending on artificial intelligence initiatives by giant corporations like Microsoft and Google, whose cash balances effectively immunize them against higher borrowing costs. Bain & Company recently forecast that “the market for AI-related hardware and software is expected to grow between 40% and 55% annually, reaching between $780 billion and $990 billion by 2027.”
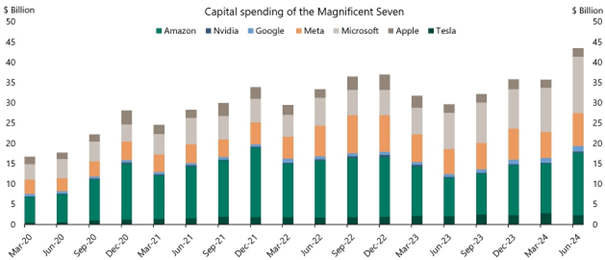
Source: Apollo Chief Economist
The positive cascading effects of the AI revolution are being felt in utilities, a traditionally staid sector. The demands of data centers (needed for AI and cloud computing) on the electric grid are so extraordinary that Microsoft recently signed a deal that will enable it to glean power from a restarted Three Mile Island nuclear plant.
Third, as we have previously noted, consumers largely locked in fixed interest rates when borrowing costs (notably on mortgages) were much cheaper. To the extent that maturing loans at low rates are refinanced with higher ones, indebted consumers are feeling the pinch. But, so far in this cycle, the pain has largely been bearable.
Financial Market Review
For the fourth consecutive quarter, the S&P 500 posted a positive return, generating 5.8% through September 30th. Among the “Magnificent Seven,” Meta and Apple stocks posted positive returns; Tesla was the biggest gainer, rising 32%. Microsoft, Amazon, NVIDIA and Alphabet declined.
Value stocks outpaced growth shares across large-, mid- and small-market capitalizations alike. U.S. mid- and small-cap value stocks were up more than 10%. International stocks also fared quite well during the quarter, with developed markets rising nearly 7% and emerging markets up 8 – 9%. China announced the most aggressive stimulus measures since the end of COVID lockdowns. Chinese shares rallied 20% in the week following the news, although they are still priced well below their February 2021 highs.
Expectations for artificial intelligence-driven demand for electricity boosted utility shares, which rose more than 19% in Q3. Real estate (17.1%), financial services (10.6%), and consumer discretionary (10.1%) sectors were also big winners. Energy was the only sector with a negative return (2.9%).
Declining energy stock prices reflected the 17% drop in crude oil prices during the quarter, as Organization of the Petroleum Exporting Countries Plus (OPEC+) signaled it would increase daily production output by 180,000 barrels in December. This represents the organization’s first supply increase since 2022. In contrast, precious metals shined, with gold and silver rising 13% and 7%, respectively.
Foreign currencies rallied in the quarter on the heels of the Federal Reserve’s 0.50% rate cut, which makes interest-bearing accounts and securities denominated in U.S. dollars less attractive at the margin. The Swiss franc was up 6% in the quarter, while the Japanese yen rallied 11%. Both currencies are now close to flat versus the United States dollar (USD) in 2024. The British pound has strengthened 6% over the greenback this year, as the Bank of England left its benchmark rate unchanged at 5% in September.
Bonds categorically rallied as the 10-year Treasury yield decreased by 0.70% to its lowest level in over a year. Corporate bonds (6%) and longer-term Treasurys (8%) were the biggest winners among fixed-income sectors.
Economic Conditions
Real GDP grew at a 3% annualized rate in Q2, up from 1.6% in the first quarter. The Atlanta Fed’s GDPNow model estimate for Q3 growth is 2.5%. Employment data continues to be surprisingly robust. Total nonfarm payroll jobs rose 254,000 in September, well above the 150,000 Bloomberg consensus estimate. The unemployment rate declined to 4.1% from 4.2% in August. Wages increased 4% on a year-over-year basis, with private sector pay up 4.7%. According to ADP, workers who changed jobs only saw a 1.9% premium versus job stayers.
The Consumer Price Index rose 2.4% year-over-year in September, as the Core CPI increased 3.3% yearly. In a sharp reversal from previous months, housing inflation eased as owners’ equivalent rent rose 0.3% and the shelter index rose 0.2% for the month. (Shelter costs comprise a third of headline CPI.) Through August, Core PCE—the Fed’s favorite inflation indicator—rose 2.2% on an annual basis.
The moderate inflation numbers emboldened the Federal Reserve to finally reverse course in September, as it cut interest rates for the first time in more than four years (by 0.50%). Fed Chairman Jay Powell emphasized that the cut was not a reaction to any economic danger signals, arguing that the move was to preempt a recession, given monetary policy’s “long and variable lag.”
In his remarks, Powell said that [the FOMC] “is not a committee that wants to cut rates quickly.” The Fed’s own “dot plot” forecast shows interest rates decreasing from the current 4.75% – 5.0% range to a 3.0% – 3.25% level by the end of 2025. The market’s primary short-term rate forecasting tool, fed funds futures, shows an 94% chance of a 0.25% cut next month. The market forecasts a 90% chance that the short-term rate will be 3% or higher by December 2025.
When the two-year yield surpassed the 10-year yield in July of 2022, the yield curve was said to have “inverted,” auguring a future rate-cutting cycle with an attendant recession. As we noted in our July newsletter, that inversion held for 24 months without a recession materializing. As the Fed finally commenced its rate-cutting cycle last month, the yield curve finally “uninverted” and has remained so since September 6th.
UNIVERSION OF YIELD CURVE: 10-Year – 2-Year Treasury Note Yield Differential
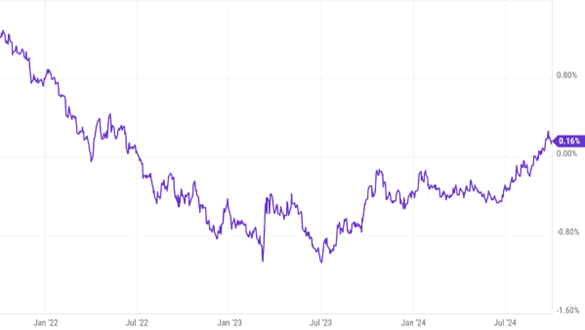
Source: YCharts
An uninversion occurs either because inflation has dropped materially and/or a recession is imminent (occurring within a year). Historically, the latter is more common than the former. The four most recent recessions—in 1990, 2001, 2007 and 2020—started between three to six months after the uninversion.
It’s a bit premature to say whether the Fed’s moves are driving the economy into recession or adeptly steering prices under control without one coming to pass. As it stands, the combination of loose fiscal policy and the AI boom may just break the yield curve’s track record as a very reliable leading indicator.
Asset Class & Sector Survey
FactSet reports that analysts are projecting earnings growth of 9.8% for S&P 500 companies in 2024, with an additional 14.9% annualized growth expected for 2025. Should those generous figures be realized, that would still leave the Index at more than 27x trailing earnings and nearly 24x forward earnings.
While forward earnings multiples are an unreliable metric for prognosticating stock market returns over a one-year horizon, valuations on the extreme high- or low-end tend to be good forecasting tools over a five-year time frame. Given today’s lofty starting level, the outlook over the next half-decade is anemic, at best.
More often than not, a large exogenous event is required to get investors to make a serious reexamination of how they’ve been pricing risk. Though we wouldn’t consider Berkshire Hathaway’s filings with the Securities and Exchange Commission to be in the same league as a war or recession, its recent 13F filings should at least give investors reason to pause.
Through June 2024, super-investor Warren Buffett’s holding company was a net seller of stocks for seven consecutive quarters, cutting its stake in Apple in half during Q2 alone. As of June 30, Berkshire’s total hoard of cash and equivalents and Treasury bills (T-bills) totaled $271.5 billion. In fact, Berkshire owned more T-bills than did the combined twelve branches of the U.S. Federal Reserve!
Inasmuch as we recognize the ability of technology to affect long-term economic change, we also respect the ability of the Fed to temper economic activity in the short term and the tendency of stock valuations to mean-revert in the intermediate term. AI may be changing much of the world we live in, but it’s not going to change everything. Watch those risk allocations.
Please reach out to us if you would like to discuss capital markets or your personal financial plan.
 Teancum D. Light, JD, CPA, CFP®
President

Chief Investment Officer
Disclosures: This material is for informational purposes only and is not rendering or offering to render personalized investment advice or financial planning. This is neither a solicitation nor a recommendation to purchase or sell an investment and should not be relied upon as such. Before taking any action, you should always seek the assistance of a professional who knows your particular situation for advice on taxes, your investments, the law or any other matters that affect you or your business. Although Lighthouse Wealth Management has made every reasonable effort to ensure that the information provided is accurate, Lighthouse Wealth Management makes no warranties, expressed or implied, on the information provided. The reader assumes all responsibility for the use of such information.