Download a PDF copy of the Lighthouse Wealth Management: Outlook – April 2024
Financial Market Review
The S&P 500 continued its Q4 strength into Q1, rallying 10.4% through March 31st—its best annual start since 2019. Five of the “Magnificent Seven” stocks posted positive returns; Nvidia rose a staggering 82%! Apple and Tesla were the Seven’s conspicuous two laggards, losing 10.8% and 29.2%, respectively.
Except for real estate, all sectors posted a positive quarterly return. Energy (13.5%), Communications (12.7%) and Financial Services (12.4%) were the biggest winners. Across large-, mid- and small-cap companies, growth stocks bested their value sector counterparts.
The AI-themed rally played out in small cap shares, as server maker Super Micro surged 237%. Super Micro and one other stock (MicroStrategy) drove more than a third of the small-cap Russell 2000 Index’s Q1 return. While other major stock indexes continue to reach new all-time highs, the Russell 2000 remains 16% below its November 2021 record level.
Developed International stocks were up 4.6% in Q1; Emerging Markets were up a modest 2.2%. In contrast to the United States’ strength, Europe’s economy has floundered of late, with zero growth in Q4 and only 0.5% growth for all of last year. The financial press has cited rising gasoline prices and tighter credit conditions as primary causes.
Stronger economic data and higher inflation prints weighed on bond prices, with the Bloomberg Aggregate Bond Index losing 1.55%. Long-term Treasurys were hardest hit, as yields climbed almost 0.50% during the quarter. There were a few bright spots, though. Convertible and high yield bonds were up 1.30% and 0.95%, respectively, on the back of stock market ebullience. Short duration bonds also eked out positive returns (2-year Treasurys returned 0.16%) as coupon payments offset the effect of small price decreases.
The Bloomberg’s Commodity Index was up just over 2% in the quarter. Gold reached a new all-time high ($2,245/ounce), rising nearly 7%. Crude oil prices were supported by the resilient U.S. economy, production support from the Organization of the Petroleum Exporting Countries (OPEC) and purchases by the Strategic Petroleum Reserve.
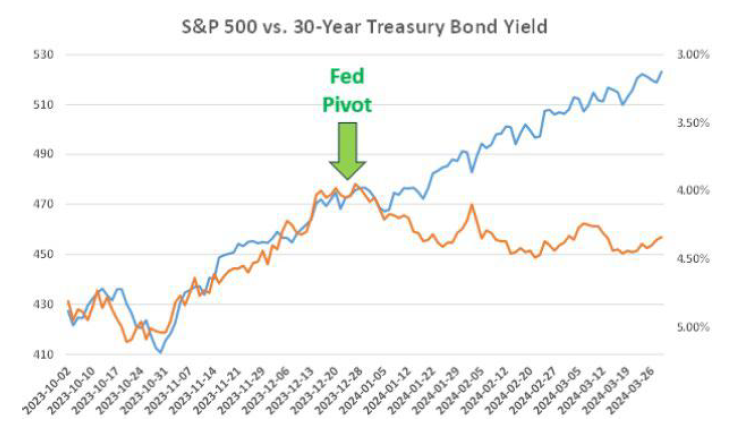
In our last newsletter installment, we noted the very high correlation between longer-term Treasury yields and stock prices during the fourth quarter. That is, as Treasury yields decreased, stock prices rose, and vice versa. Shortly after the Fed made its “pivot” last December (indicating that it foresaw several rate cuts forthcoming in 2024), the relationship began to break down. Since January, stocks have rallied, notwithstanding higher long-term interest rates.
Economic Conditions
U.S. real gross domestic product (GDP) grew at a 3.4% annualized rate in Q4, up from a 3.2% estimate, as economic strength continues to defy recession expectations. Growth has been driven both by increased labor force participation (at least partially due to immigration) and higher productivity.
According to the Labor Department, nonfarm productivity, which measures hourly output per worker, increased at a 3.2% annualized rate last quarter. The increase was conspicuous: productivity growth averaged only 1.2% in 2023, after contracting -1.9% in 2022. Over the past four years, the annual growth rate has been only 1.6%.
The March jobs report came in much stronger than expected, as the economy added 303,000 jobs during the month. The unemployment rate fell from 3.9% to 3.8%, as labor force participation rose slightly. In another positive sign, ADP data showed a median year-over-year pay increase for job switchers of 10% in March, the highest rate of growth since July of 2023. NFIB surveys also indicate that more small businesses are planning to raise worker compensation.
Other economic data has been comparably robust. In March, the Institute for Supply Management’s manufacturing Purchasing Managers’ Index (PMI) moved into expansion for the first time since September of 2022. The University of Michigan’s Consumer Sentiment Index reached its highest recorded level since July of 2021.
In March, the Federal Open Market Committee kept its target overnight lending rate unchanged at 5.25% – 5.50%, maintaining expectations for three cuts this year. Futures markets are likewise expecting a 0.75% decrease in short-term rates by the end of 2024. As recently as December, the market was expecting six rate cuts.
The resumption of the “higher-for-longer” interest rate story is due both to the above-mentioned stronger economic data, as well as inflation readings that remain stubbornly above the Fed’s target 2% level.
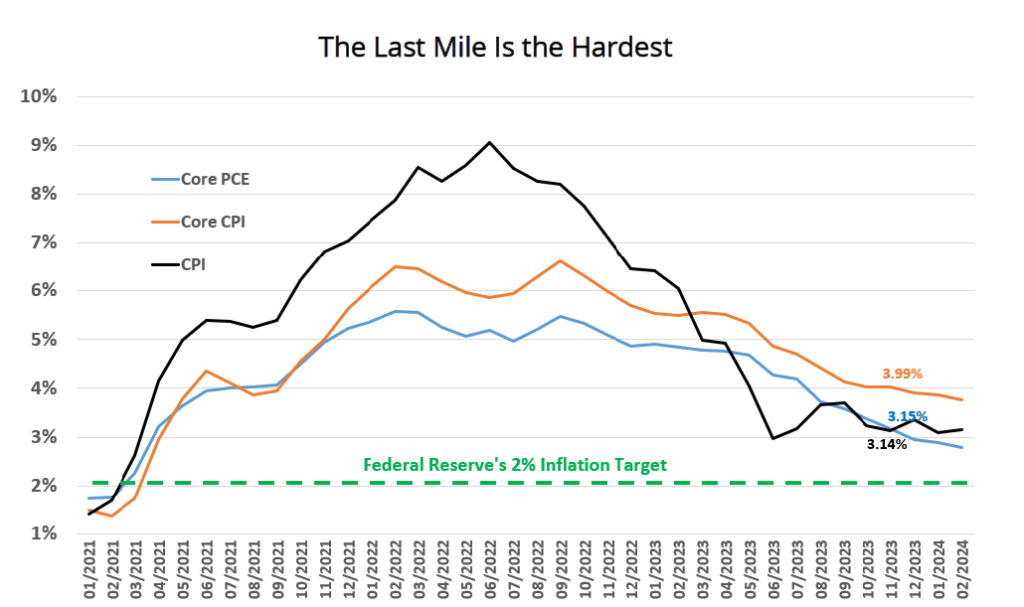
The Core Personal Consumption Expenditures (PCE) price index, the Fed’s preferred inflation metric, rose 2.8% over the prior year in February. The Core Consumer Price Index (CPI) was even higher in March, up 3.8% versus a year ago. Although goods inflation is near zero, services inflation remains stubbornly high, and was 5.2% in February.
The Last Mile Is the Hardest
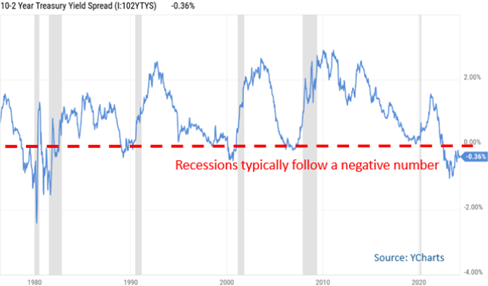
Source: YCharts
The Treasury market set a new record on March 20th for “Longest Yield Curve Inversion in American History.” As 2-year Treasury yields surpassed 10-year yields in July of 2022, the curve inverted, and remained so for more than 645 days. The milestone was particularly significant because a 2-year/10-year inversion has been an extremely reliable economic indicator, with recessions typically materializing 12 to 18 months after the curve initially inverts.
It’s rather premature to conclude that a recession has been avoided altogether, but it’s worth asking the question why, if one does arrive in 2024, it’s at least six months overdue. Several reasons come to mind:
- Due to large COVID-era subsidies and wealth effects of higher stock and real estate prices, consumer balance sheets are much stronger than is typical in the later stages of a business cycle.
- Measures taken by the Fed during the banking crisis a year ago have facilitated the flow of credit much more than would otherwise have been expected.
- Locking in all-time-low borrowing rates during the pandemic has reduced household debt service payments to very modest levels.
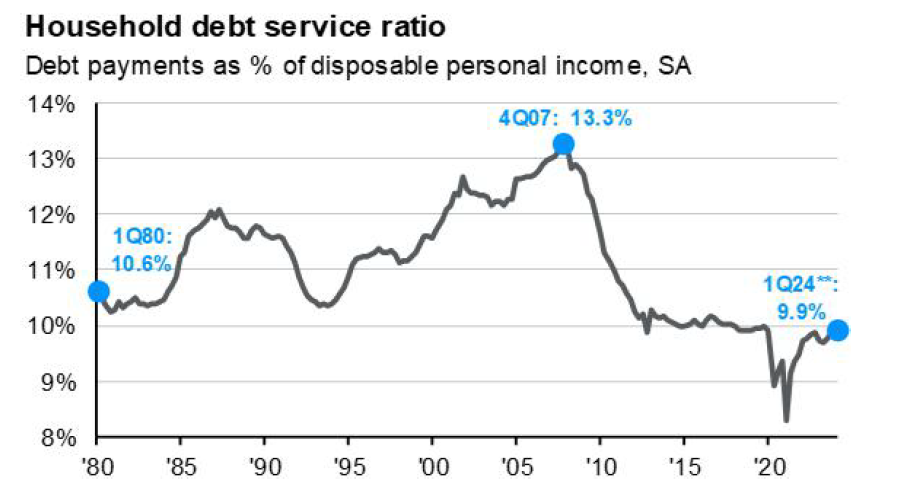
Source: JPMorgan
Asset Class & Sector Survey
Decades ago, Roy Amara, the former president of the Palo Alto-based Institute for the Future, posited: “We tend to overestimate the effect of a technology in the short run and underestimate the effect in the long run.” While he may not have had capital markets specifically in mind, “Amara’s Law” certainly applies there as well.
In the late 1990s, promises of an exciting new technology—the internet—drew the excitement of individual and institutional investors alike. From 1996 through 1999, the S&P 500 returned an impressive 154%, while the technology-heavy Nasdaq Composite returned an astounding 287%. Effervescent, to say the least.
The next five years (2000-2004) were far less kind, with the S&P 500 losing a cumulative 11% and the Nasdaq cratering by 47%. However, the stock plunges didn’t reflect the failure of technology to change patterns of production and consumption. Rather, the declines were due to the slower earnings impact of technology, relative to prior expectations.
Today, sentiment regarding AI is quite bullish, both in mainstream media and the financial press. As Goldman Sachs recently noted, 36% of Q4 earnings calls have mentioned it.
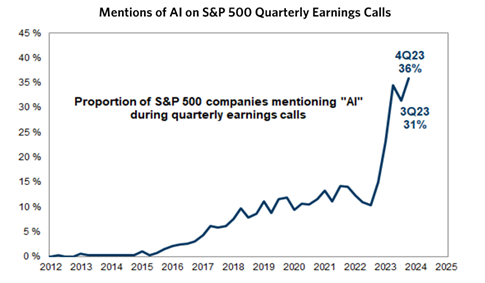
Source: Goldman Sachs Global Investment Research
It is certainly tempting to draw one-for-one parallels between today’s market exuberance and that of a quarter-century ago. But the majority of today’s tech juggernauts (e.g., Microsoft, Google and Meta) are cash-generating machines, rather than so many cash-bleeding stock market darlings that captured investor hearts during the Y2K run-up. (When was the last time you shopped at Pets.com?)
Another differentiator from the dotcom market of yesteryear: the breadth of today’s rally. In the late 1990s, shares of many stable, cash-generating businesses were left to eat the Nasdaq’s dust. Despite respectable earnings, share prices of “Old Economy” companies were of little to no interest to “modern” investors.
In contrast, the recent stock rally has been conspicuously broad—even in sectors that don’t directly benefit from the production of AI goods and services. Since the bull run began last November, an equal-weighted index of S&P 500 companies is also up by the same amount as the market-cap-weighted index (24%).
Although the equal-weighted S&P 500 trades at a discount to its market-cap-weighted cousin, (21x trailing earnings versus 25.5x), the equal-weighted index is hardly in bargain territory, and much earnings growth has yet to materialize. According to FactSet, consensus Q1 2024 earnings growth for S&P 500 companies is a modest 3.2%. Notably, Goldman Sachs’ equity strategy team breaks this down further: the top 10 stocks have 32% expected growth; earnings for the other 490 are anticipated to decline by 4% in Q1.
Markets are clinging to the hope that the recent acceleration in economic growth will soon translate into higher earnings. For the full year, the Street is projecting S&P 500 earnings to grow 10.9%. If stock prices are going to hold up through the rest of 2024, earnings will need to finally deliver.
Please reach out to us if you would like to discuss capital markets or your personal financial plan.
 Teancum D. Light, JD, CPA, CFP®
President

Chief Investment Officer
Disclosures: This material is for informational purposes only and is not rendering or offering to render personalized investment advice or financial planning. This is neither a solicitation nor a recommendation to purchase or sell an investment and should not be relied upon as such. Before taking any action, you should always seek the assistance of a professional who knows your particular situation for advice on taxes, your investments, the law or any other matters that affect you or your business. Although Lighthouse Wealth Management has made every reasonable effort to ensure that the information provided is accurate, Lighthouse Wealth Management makes no warranties, expressed or implied, on the information provided. The reader assumes all responsibility for the use of such information.