
To download the PDF copy, click here: Lighthouse Wealth Outlook – October 2026
Market Outlook – October 2026
“Crowding Out”
During an introductory course in macroeconomics, undergraduate students are introduced to the concept of “crowding out.” The term refers to the idea that increased government borrowing can displace, or “crowd out,” private-sector borrowing and investment.
More government borrowing → greater demand for loanable funds → higher real interest rates for everyone else → less borrowing by non-government entities
The crowding out effect was in full force in the third quarter on three fronts:
1. The U.S. national debt surpassed the $40 trillion mark in mid-August. The total budget deficit for 2026 is estimated to be in excess of 6% of GDP. Federal debt held by the public is now 100% of GDP, the highest in any fiscal year other than 1945 and 1946 (when World War II concluded). Current projections suggest the trend will continue.
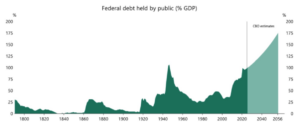
Source: U.S. Congressional Budget Office, Macrobond, Apollo Chief Economist
2. AI hyperscalers. The “Big Five” of Amazon, Alphabet, Oracle, Meta, and Microsoft are on pace to collectively tap the bond market for $250 billion this year—more than seven times their average annual bond issuance from 2020-2024. When all AI-related issuance is taken into consideration, it accounts for more than half of U.S. investment-grade corporate bond issuance in 2026.
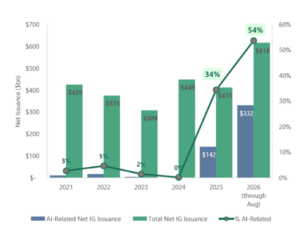
Source: Apollo Chief Economist
3. Global sovereign borrowing. Competition for capital is hardly limited to the United States, as rising G7 government bond yields illustrate.
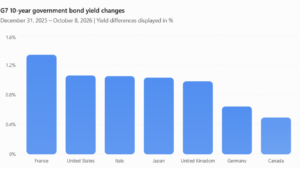
Source: Bloomberg
Tempting though it may be to blame higher interest rates as the product of elevated inflation levels, Treasury Inflation-Protected Securities (TIPS) indicate that real yields are at their highest levels outside of the Global Financial Crisis.
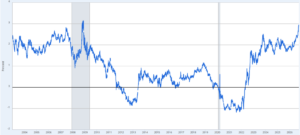
Source: Federal Reserve Bank of St. Louis
The inescapable mathematical consequence of these higher yields: lower bond prices. If 2026 finishes with bond prices near the current level, it will mark the third–worst calendar–year return in the index’s 50-year history, displacing 2013 and trailing only 2022 and 1994:
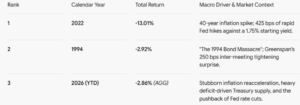
Source: YCharts
Barring the early 1980s, the five years ending September 2026 have been the most punishing five-year period for investment-grade bondholders in the history of the Bloomberg U.S. Aggregate Bond Index. Annualized nominal returns were 0.64%, and an abysmal 4.53% below the rate of inflation.
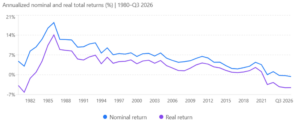
Source: Upmyinterest.com, Federal Reserve Bank of Minneapolis
As bad as things have been for the intermediate-term bonds represented by the index, things have been even worse for holders of long-term bonds, with corporate and Treasury indexes down 6% and 7%, respectively, YTD.
Outlook readers may recall our words of caution from our January publication:
“Over the next decade, fiscal realities will force Uncle Sam into some combination of spending reductions, tax increases and currency devaluation. Historically, the latter has been the least painful course for politicians—and, therefore, the most likely to be realized. If you would prefer not to be the one stuck paying a hefty ‘inflation tax’ in a few years, we’d advise steering clear of long-term bonds.”
While the “inflation tax” has yet to be paid, it’s beginning to appear that the bloated tabs of many national governments—the U.S. chief among them—are on the verge of finally coming due.
Financial Market Review
The S&P 500 Index gained 2.4% during the quarter, raising its year-to-date return to 12.7%. Small- and mid-cap stocks, which had risen nearly 25% and 20% from January to August, respectively, declined sharply beginning in mid-August as expectations rose that the Federal Reserve would begin tightening monetary conditions. In the small- and mid-cap space, value stocks outperformed growth stocks. Conversely, in large caps, growth stocks beat their value counterparts as the AI trade rolled on. International stock indexes posted modest losses for the quarter, although USD-hedged shares fared a few percentage points better.
Energy shares posted the best sector return (16.5%) on a 30% jump in crude oil prices and a massive jump in refining margins. Health care stocks finished second, up 6.6%. Utility stocks were the worst performers, at least partially driven by higher interest rates. The Magnificent Seven were up 11.5% in the quarter. Microsoft led the group, gaining an astounding 38%. Software stocks generally fared well, up 17.5%, as the “SaaSpocalypse” narrative reversed on strong earnings.
The U.S. dollar staged a sharp “V-shaped” recovery in Q3 2026, transitioning from mid-summer weakness into an aggressive late-quarter rally. The Fed’s September rate hike and projections for an additional 0.25% hike in the U.S. before year end strengthened the greenback versus its peers.
The Bloomberg Commodity Index surged over 15% in Q3, marking its strongest quarterly performance in several years. The advance was overwhelmingly led by the energy complex, where crude oil spiked and refined product crack spreads widened to historic highs amid acute middle distillate shortages. In August, the U.S. Gulf Coast diesel crack spread cleared $100 per barrel for the first time on record versus a typical spread of $15–$25 per barrel.
The Bloomberg U.S. Aggregate Bond Index declined 3.5%, its seventh-worst quarterly return on record and its weakest quarter since 2022. Treasury yields rose sharply, as the 10-year climbed from 4.42% at the end of June to 5.29% on September 30—its highest level in 24 years. The 30-year Treasury yield ended the quarter at 5.64%, its highest level since 2002.
Economic Conditions
Real GDP grew 2.2% annually in the second quarter of 2026, down slightly from 2.5% in Q1. Consumer spending accelerated to a 3.8% annual rate in Q2 vs. 0.7% in the first three months of the year. Business investment (ex-housing) rose 9%, driven by AI-related spending. The Atlanta Fed’s GDPNow model forecast for Q3 real GDP growth is 3.7%.
The Consumer Price Index rose 3.7% YoY in September, driven by higher fuel costs. Core inflation (which excludes food and energy) was up 2.6%, driven by travel and leisure prices. Core PCE, the Fed’s key metric for policy decisions, rose 3.0% YoY in August, holding level for the past three months.
The U.S. added just 29,000 jobs in September (missing expectations of 90,000), as the unemployment rate ticked up to 4.2%. Gains came primarily within the healthcare sector, continuing the trend. The labor force participation rate increased 0.2 percentage points to 61.8%, exceeding expectations. Average hourly earnings rose 0.1% from August and are up 3% YoY, consistent with core inflation.
At the September 15–16, 2026 meeting, the Federal Reserve voted unanimously to raise the benchmark federal funds rate by 25 basis points to a target range of 3.75% to 4.00%. In its decision, the Fed pointed to elevated inflation pressures, geopolitical tensions, spiraling energy costs, and strong domestic economic activity, consumer spending, and productivity. The Fed is forecasting one additional rate hike in 2026; futures markets assign an 80% chance.
Asset Class and Sector Survey
In January, FactSet had projected 2026 earnings growth of 14.9% for S&P 500 companies. As of mid-October, the refreshed full year estimate stands at 32.4%.” Just ten companies’ earnings account for two-thirds of the projected growth in Q3: Nvidia and Micron alone account for more than one-third of the total.
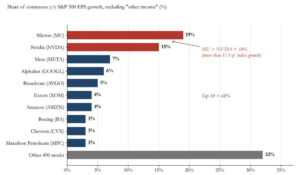
Source: ZeroHedge, Goldman Sachs Global Investment Research, FactSet
The S&P 500 is now trading at roughly 19.0 times its constituents’ projected earnings over the next 12 months, down from 22.2 times at the beginning of the year. The decrease in valuations likely boils down to:
- Higher interest rates across the yield curve
- Geopolitical risks attendant with the Iran war
- Rising credit spreads for tech borrowers as AI monetization doubts build—4/5 of the hyperscalers are projected to go “free cash flow negative” in 2027 (see chart below)
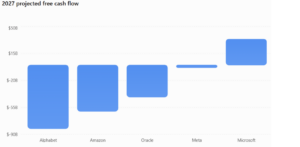
Source: S&P Global
To say that we’re living in an AI-driven stock market would be a gross understatement. But it would be a gross error of omission to neglect the massive cascading effects of the AI buildout on the bond and commodity markets. Enormous demands for raw materials and capital are placing upward pressure on input prices and borrowing costs across the global financial ecosystem.
Whatever pain Uncle Sam or Big Tech may feel from higher borrowing costs, it will likely take considerably more before the former becomes serious about fiscal reform or the latter meaningfully curtails the AI buildout. In the interim, we expect the competition for capital to be felt most acutely by small business borrowers and consumers as rates exceed 7%, even for prime borrowers.
In prior newsletters, we’ve confessed our inability (or at least unwillingness) to prognosticate the timing and scale of how the AI story materializes. But should “the AI trade” suddenly reverse across the stock and corporate bond markets alike, we would generally expect Treasuries and municipal bonds to be the primary beneficiaries.
AA-rated intermediate-term municipal bonds can be found yielding over 4% today, offering a tax-equivalent yield approaching 7% for investors in the highest marginal tax brackets. We generally prefer them to cash. But given the adverse effects of the AI buildout on bond prices, we would recommend offsetting the risks of an all-bond portfolio by concurrently owning some stocks leveraged to AI. That’s something nobody ever read in Finance or Econ 101!
Please reach out to us if you would like to discuss capital markets or your personal financial plan.

Teancum D. Light, JD, CPA, CFP®
President

Chief Investment Officer
Disclosures: This material is for informational purposes only and is not rendering or offering to render personalized investment advice or financial planning. This is neither a solicitation nor a recommendation to purchase or sell an investment and should not be relied upon as such. Before taking any action, you should always seek the assistance of a professional who knows your particular situation for advice on taxes, your investments, the law or any other matters that affect you or your business. Although Lighthouse Wealth Management has made every reasonable effort to ensure that the information provided is accurate, Lighthouse Wealth Management makes no warranties, expressed or implied, on the information provided. The reader assumes all responsibility for the use of such information.