
To download the PDF copy, click here: Lighthouse Wealth Outlook: July 2026
Market Outlook
“A Tale of Two Markets”
“It was the best of times, it was the worst of times, it was the age of wisdom, it was the age of foolishness ….”
So begins Charles Dickens’ 1859 novel, “A Tale of Two Cities.” Set in London and Paris before and during the French Revolution, Dickens structures his characters’ lives so that one person’s “best of times” mirrors another’s “worst of times.” For readers who have been following both stock market and economic news of late, it is difficult to summarize recent events better than with Dickens’ opening line.
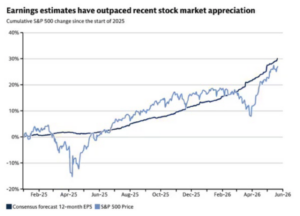
On one hand, the cascading effects of the artificial intelligence (AI) revolution are minting thousands of new millionaires each month, as the stock market looks set to deliver its fourth consecutive year of double-digit returns. Tempting though it may be to dismiss the S&P 500’s 10% year-to-date (YTD) return as dot-com-era “irrational exuberance,” the simple fact is that earnings, not multiple expansion, have driven the entirety of this year’s rally.
The “Magnificent 7” companies reported actual earnings growth of 63.2% for the first quarter, which is their highest earnings growth rate since Q2 2021 (89.2%). The “Other 493” haven’t fared badly, either. Their blended earnings growth rate for Q1 is 17.4%, their highest reported since Q4 2021 (32.3%).
Source: FactSet, Goldman Sachs
Inasmuch as the bottom lines of the Magnificent 7 continue to impress, the earnings growth of the chipmakers and semiconductor manufacturers supplying the hardware to Meta, Google and others for their AI buildouts has been absolutely staggering. To name two examples: Micron and Intel saw their share prices jump by 304% and 278%, respectively, since New Year’s Day. As Samsung’s CEO recently observed, “This year’s profit alone will exceed the cumulative profit generated over the 40 years since Samsung entered the semiconductor business.”
But for all the AI and AI-adjacent enthusiasm that is boosting earnings and share prices today, consumers appear far less optimistic on the technology’s merits. Pew Research relates that half of U.S. adults say the increased use of AI in daily life makes them feel more concerned than excited. About the same percentage believe that AI will worsen people’s ability to think creatively and form meaningful relationships with others. But the most vocal, and often the most successful, opposition to the AI revolution in recent months has centered on data center construction.
A new study by Data Center Watch, a project of AI intelligence firm 10a Labs that tracks local data center activity, found that opponents successfully blocked or delayed at least 75 data center projects nationwide worth about $130 billion from January through March 2026. According to Bloomberg, nearly half of the nation’s planned 16 gigawatts of capacity faces cancellation or delay, with only five gigawatts currently under construction.
In addition to the quality-of-life concerns raised by AI growth, observers have noted that, to date, the vast majority of wealth accruing from the technology has accrued to a relatively small minority of Americans. The richest 10% of American households own 87% of the country’s stock market wealth, with the top 1% holding nearly 50% of the value.
In contrast, there are numerous signs that a significant percentage of Americans are now struggling to a greater degree than at any time since the Global Financial Crisis (GFC):
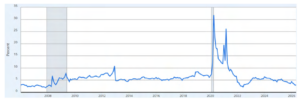
1. In May, the personal savings rate fell to a multi-decade (barring the “Great Post-Covid Spend of 2022”) low of 3.0%. Since early 2024, American households have burned through nearly four percentage points of savings as years of higher borrowing costs and persistent inflationary pressures continue to weigh on household balance sheets.
Personal Savings Rate
Source: U.S. Bureau of Economic Analysis via Federal Reserve Bank of St. Louis
2. The economy is increasingly dependent on high-income consumers. A new report from Moody’s Analytics shows the top 10% of earners now account for nearly half of all U.S. consumer spending, the highest concentration recorded since Moody’s began tracking it in 1989. (The high-income share was roughly 43% in 2020.)
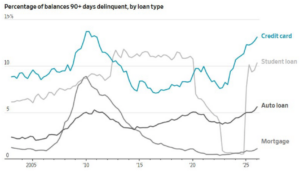
3. Credit card and auto loan delinquencies have reached their highest levels since the Global Financial Crisis.
Source: The Wall Street Journal
4. Recent gains in the labor market have been unevenly distributed. Of the 369,000 jobs the Labor Department says were created since January 2025, nearly all of them went to women, with only 21,000 going to men. The lopsidedness was driven by huge growth in health care, where women hold nearly 80% of jobs. Manufacturing employment is still down 82,000 jobs from when President Trump took office.
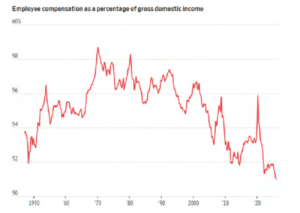
5. Workers’ share of U.S. economic output has fallen to its lowest level since the government began keeping records in 1947. Conversely, the share captured by corporate profits has risen to its highest level since 1950. Adjusted for inflation, hourly wages have increased 3% since the end of 2019, while corporate profits have surged 50%.
Source: The Wall Street Journal
Despite these challenges, U.S. consumers remain surprisingly resilient overall. For the past two years, consumer spending has managed to exceed what the disposable income data would seem to permit. One plausible answer to this unusual trend: baby boomer retirement.
As boomers retire, their earned income disappears as their spending capacity becomes dependent on Social Security, pensions and accumulated wealth. Whether that money is used for their own spending or to support their children and grandchildren, this shift from saving to spending may be the most important reason consumer activity has remained stronger than income data alone would suggest.
Financial Market Review
The S&P 500 Index gained 15.2% during the quarter, recovering its modest Q1 losses and bringing total YTD returns to just over 10%. Growth stocks outperformed value stocks across large-, mid- and small-capitalization shares alike. Small-cap growth stocks were the biggest winner, up 25.7% in the quarter. International Developed Market indexes were up between 8.5% and 12%, depending on their weight to Korean markets (which surged due to computing hardware and memory companies). Similarly, Emerging Markets Indexes’ exposure to semiconductor manufacturing propelled them to gains of over 22%.
Technology shares posted a tremendous 43.5% return as AI infrastructure spending continues to accelerate. Energy stocks lost 12.7%, giving back a third of their Q1 return as oil prices fell. All other sectors were positive, with the exceptions of Communication Services (3.1%) and Utilities (0.6%). Meta was the only Magnificent Seven stock to post a decline (1.4%).
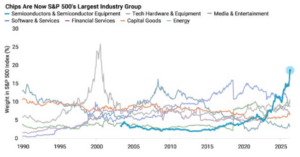
Memory and AI-chip companies were the strongest performers. In recent months, semiconductors have surged past every other industry group and now represent roughly 18% of the S&P 500 Index.
Source: Bloomberg, Redwood Investment Management.
The U.S. dollar continued its Q1 strength as a more hawkish Federal Reserve and resilient U.S. economic data pushed it higher against most major currencies. (Record net foreign inflows into U.S. equities have provided further support.) The Japanese yen was the major laggard, falling to ¥162 versus the U.S. dollar—a level unseen since 1986. Markets have become increasingly concerned about Japan’s fiscal outlook, despite the possibility of future Bank of Japan (BOJ) rate hikes. Tellingly, the BOJ has started to “encourage” Japanese pension funds to sell foreign government bonds and buy Japanese bonds.
The Bloomberg Commodity Index dropped nearly 9%, driven by a $30 per barrel decline in spot crude oil prices. Precious metals also declined sharply, with gold and silver falling 14% and 22%, respectively. Industrial metals, like copper and aluminum, fared better on resilient structural demand for AI data centers, power grids and electric vehicles.
All major bond markets generated a positive return as a May spike in Treasury yields largely receded by the end of June. The Barclays Aggregate Index returned 0.7%, with corporate bonds (1.1%) making the largest contribution. Intermediate- and long-term municipal bonds had an excellent quarter, returning about 2% and 3%, respectively.
Economic Conditions
Q1 GDP growth was unexpectedly revised up to 2.1% annually. A large downward modification to imports was the primary factor in the change (up from 1.6% in the previous estimate). Personal consumption expenditures growth was revised down to 0.5%, the slowest pace since Q1 2022. The Atlanta Fed’s GDPNow model forecast for Q2 real GDP growth is 1.3%.
The Consumer Price Index (CPI) fell a seasonally adjusted 0.4% in June, thanks to lower energy prices, bringing the annual inflation rate down to 3.5%. Core CPI (which excludes food and energy) was flat for the month, putting its 12-month rate at 2.6%. Core Personal Consumption Expenditures (PCE) rose 4.1% YoY in May, up from 3.8% in April.
Nonfarm payrolls increased by just 57,000 in June as the number of Americans filing for unemployment benefits for the first time dropped to just 208,000. The unemployment rate dipped to 4.2% as the labor force participation rate fell 0.3% to 61.5%, the lowest since March 2021 (during the Covid pandemic). The broadest measure of labor underutilization (U-6 unemployment) now stands at 7.9%, consistent with year-ago levels. Average hourly earnings rose 3.5% year over year (YoY), leaving wage gains precisely consistent with headline inflation.
At its June meeting, its first with new chairman Kevin Warsh, the Federal Reserve held its benchmark rate steady at 3.50%–3.75%. Elevated inflation readings have moved Fed governors into a higher-for-longer posture; nine of 19 officials penciled in at least one rate increase by year’s end. The fed funds futures market is currently pricing an 80% chance of at least one interest rate hike by December.
During his confirmation hearing, Warsh said that the Fed needs a different framework for approaching inflation. He is set to revamp the Fed, appointing over a dozen external experts and business leaders to lead five independent task forces charged with overhauling its monetary policy operations. In his view, the PCE, traditionally the Fed’s key metric for policy decisions, offers only a rough take. Instead, Warsh favors “trimmed averages” of inflation that remove outlier data.
In contrast to his predecessors, Warsh’s most recent statement was very concise and avoided any hint of the Fed’s next move. However, his rhetoric did reflect a firm stance on inflation: “We have the capability and commitment to deliver on our price stability objective. That’s exactly what we’re going to do.” Warsh is also generally expected to reduce the Fed’s balance sheet (which more than doubled during the pandemic) but has since declined by roughly one-quarter over the past four years.
Asset Class and Sector Survey
Nobel Prize-winning economist Harry Markowitz, the father of Modern Portfolio Theory, famously coined the phrase: “Diversification is the only free lunch in investing.” The idea reflects his insight that, while pursuing a higher potential return from a single investment typically requires accepting greater downside risk, a diversified portfolio can offer a much more favorable risk-return profile. In other words, by making allocations across various asset classes, sectors and geographic regions, investors could reduce a portfolio’s overall volatility and risk without sacrificing expected returns.
The math supporting Markowitz’s conclusion was based on one key assumption; namely, that the correlations of price movements among the individual investments were less than 1.0. Historically, that assumption has certainly been a reasonable one to make: bonds often zigged when stocks zagged, international stocks had decent years when U.S. shares fell out of bed and gold often fared well when bonds faltered.
But correlation assumptions only hold so long as each security and each asset class reacts somewhat differently to various factors. If, however, most securities begin to respond to the same stimuli with movements in the same direction and magnitude, then constructing a meaningfully diversified portfolio becomes a far more difficult exercise.
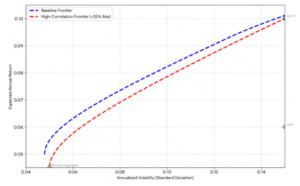
As an illustration, the dotted blue line in the graph below represents an “efficient frontier” of potential portfolios, each maximizing return for a given level of risk. It is comprised of five asset classes (S&P 500, MSCI All Country World Index Ex-US, U.S. Small Cap, Barclays Aggregate U.S. Index and Gold). Historic returns, volatilities and inter-asset class correlations are assumed. The red line represents an efficient frontier with the same prospective asset returns and volatilities, but with an upward 25% adjustment of inter-asset class correlations (capped at 0.95). Its lower position versus the blue line reflects the reduced diversification benefits stemming from the higher correlations. That is, even if individual asset class returns and risk are the exact same, portfolio returns are lower for any given level of risk.
Source: YCharts, Lighthouse Wealth Management
At first glance, the above exercise may seem merely academic, but given how much of the pricing of so many asset classes today is directly dependent on the “AI trade,” it’s terribly relevant. Consider:
- AI investment now accounts for over 25% of U.S. GDP growth and 8% of GDP, exceeding the dot-com bubble’s all-time peak of 6.5% (Bloomberg).
- JPMorgan recently compiled a list of 41 AI-related stocks, demonstrating that those names now account for nearly half of the S&P 500’s market value.
- A collective of $69.2 billion of the S&P 500’s Q1 reported profits were the result of Google, Nvidia and Amazon marking up the value of their stakes in private AI companies.
- A single company—Nvidia—stands to represent 18% of the estimated 2026 EPS growth for the S&P 500 this year, per Goldman Sachs. Micron is projected to account for 14%.
- International stock index performance is increasingly levered to AI: The MSCI Korea Index returned over 85% in Q2 on a parabolic surge in hardware/memory heavyweights SK Hynix and Samsung Electronics. The MSCI Taiwan Index returned over 55%, largely thanks to Taiwan Semiconductor Manufacturing Company.
Stock prices do not appear to reflect any slowdown in related capital expenditure next year, although a recent JPMorgan analysis found that more than 60% of data-center capacity planned for completion in 2027 isn’t yet under construction and another 7% is delayed. Indeed, there are meaningful reasons to believe that the buildouts may not proceed as planned:
- The aforementioned effective grassroots opposition, as discussed above.
- Release of AI models that require less computing power than anticipated.
- Falling AI token prices could decrease the attractiveness of new projects.
- Higher funding costs, as hyperscalers have recently brought tens of billions of bonds and stocks to market for these projects.
AI has been the overarching support for both the global economy and stock prices for the past three years. With so much wealth riding on a single theme, a slower-than-anticipated build-out would not just be a sector problem; it would materially risk tipping the economy into recession and many global stock markets into a meaningful correction.
Please reach out to us if you would like to discuss capital markets or your personal financial plan.

Teancum D. Light, JD, CPA, CFP®
President

Chief Investment Officer
Disclosures: This material is for informational purposes only and is not rendering or offering to render personalized investment advice or financial planning. This is neither a solicitation nor a recommendation to purchase or sell an investment and should not be relied upon as such. Before taking any action, you should always seek the assistance of a professional who knows your particular situation for advice on taxes, your investments, the law or any other matters that affect you or your business. Although Lighthouse Wealth Management has made every reasonable effort to ensure that the information provided is accurate, Lighthouse Wealth Management makes no warranties, expressed or implied, on the information provided. The reader assumes all responsibility for the use of such information.