Download a PDF copy of the Lighthouse Wealth Management here: Outlook – January 2023
The Great Rate Reset
“A firm is a cash-generating machine,” asserted a business school professor, scrawling the same words on the chalkboard. He continued: “And there are only two fundamental reasons for the value of any firm to increase: one, it is expected to generate more cash flow or two, the value that investors assign to that cash flow rises.”
The professor then went on to explain that the value of any firm today was the present value of its expected cash flows, discounted by some interest rate. He wrote this formula:
He concluded: “The only way for the firm to increase in value is if investors expect that cash flows will increase or the discount rate decreases. But if cash flows decrease and/or interest rates increase, the stock price will decrease.”
A very odd thing happens as the value of the discount rate approaches zero, namely: the value of the firm increases exponentially. A business that is expected to generate $100 of cash, year in, year out, discounted at 5%, is worth $2,000. But at a rock-bottom 1% rate, the firm is suddenly worth $10,000. The five-fold increase in the value of the business has nothing to do with its prospects; it has everything to do with interest rates.
The professor’s lecture—and his algebra—come forcefully to mind lately. It explains much of the stock market dynamic in 2020 and 2021 as the Federal Reserve (the Fed) cut short-term rates to zero and purchased almost $5 trillion worth of bonds.
“TINA,” the acronym went. “There Is No Alternative to stocks.” In a world with no yield anywhere, you couldn’t argue with the math. With interest rates so low, future cash flows were worth more. The S&P 500 did a moonshot, along with bond and real estate prices. Everything was great for all three asset classes—so long as those low interest rates stayed around.
They didn’t.
Financial Market Review
The Federal Reserve made a conspicuous about-face in 2022, moving from an ultra-dovish policy during COVID into a subsequent aggressive anti-inflation campaign. As the Fed reduced its bond holdings and commenced a rapid series of interest-rate hikes, stock and bond prices were both hammered.
After falling by 24% through September 30th, the S&P 500 Index rallied by more than 7% in Q4 to finish the year down 18.1%. It marked the worst year for the Index since 2008. The Nasdaq Composite lost 33%, its worst year of underperformance since 2002. The Nasdaq’s heavy skew towards communication services (down 40%), consumer discretionary (down 37%), and information technology (down 28%) companies drove the underperformance.
Only two sectors generated positive returns in 2022. Energy was up a whopping 65% for the year, even though crude oil prices ultimately finished December where they started last January ($78/barrel). Utility shares posted a modest 2% return. Lower-volatility sectors such as health care and consumer staples, were slightly negative (2.1% and 0.8%, respectively).
Across all market capitalizations, value stocks outpaced growth stocks by huge margins in 2022. In particular, large value stocks outperformed large growth shares by nearly 24%. Despite the decline of all major currencies versus the U.S. dollar, international stocks still managed to slightly outperform American shares. They were down 16.1% for the year.
Bonds posted their worst year in modern history in 2022. The Bloomberg U.S. Aggregate Bond Index lost 13%. The U.S. Treasury 10-year note returned negative 16% as its yield rose from 1.5% to 3.9%. And while pundits had touted Treasury Inflation-Protected Securities (TIPS) as a panacea, an increase in yields still made them lose 12%.
Bloomberg U.S. Aggregate Bond Index Total Return
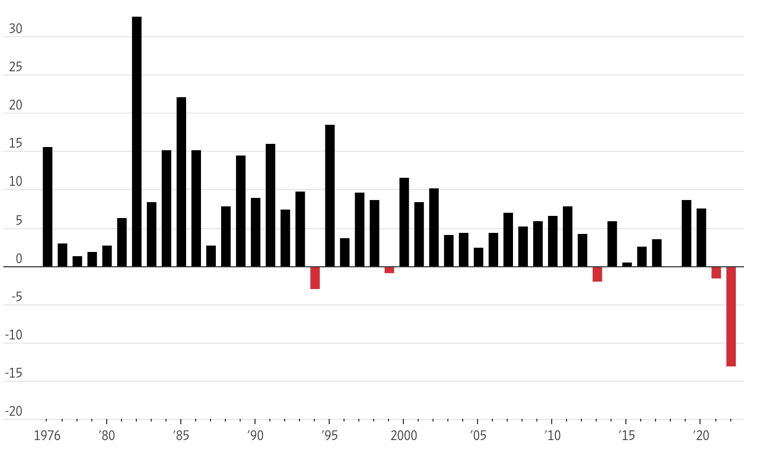
Source: The Wall Street Journal, FactSet
Fallout from the Ukraine war, lingering COVID-era supply chain disruptions and the lagged effects of the Federal Reserve’s 2020-2021 money printing enabled commodities to post a strong return for the year. The Bloomberg Commodity Index was up 16% for 2022, despite the higher interest rates (which tend to weigh on commodity prices).
Economic Conditions
Real gross domestic product (GDP) increased at an annual rate of 3.2% in Q3 2022. The number was a considerable improvement following a decrease of 0.6% in the second quarter and 1.6% in the first. The Atlanta Fed is currently projecting Q4 GDP of 3.5%.
Inflation continues to run high, although the pace of price increases has begun to taper off in recent months. The Consumer Price Index (CPI) rose 6.5% year-over-year in December, down from more than 9% in June. Notwithstanding the slowing rate of increases, prices are still ticking far higher than the Fed would prefer. (The core rate inflation rate of 5.7% is well above its 2% target.)
Although corporate layoffs (notably in the tech sector) have been capturing headlines over the past few months, the job market remains very strong in aggregate. With a national unemployment rate of only 3.5% in December, there are currently four million more job openings than job seekers.
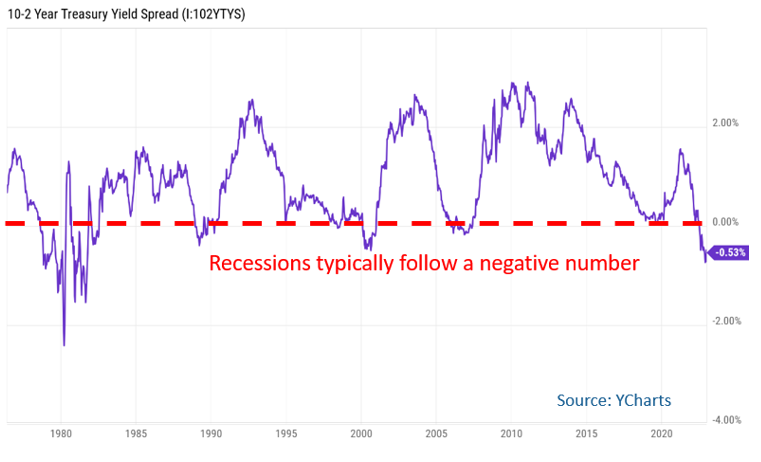
The lofty inflation rate and low employment rate continue to embolden the Fed in its tightening agenda. Short-term Treasury rates have risen above intermediate- and longer-term yields. Since 1986, every such yield curve “inversion” has been followed by a recession.
There are several other reasons to expect a recession over the next 12 – 16 months:
- The New York Fed’s Recession probability model has climbed above its 2020 peak and is now at its highest since the Global Financial Crisis.
- The last eight times the Chicago PMI report was below 40, as it was in November, a recession occurred.
- Higher borrowing costs have started to weigh on consumer demand for long-term goods. The average interest rate for used car buyers is near 7%, the highest in 12 years.
- Every time monthly supply of new houses has exceeded nine months, a recession has followed. The current supply is 10.8 months.
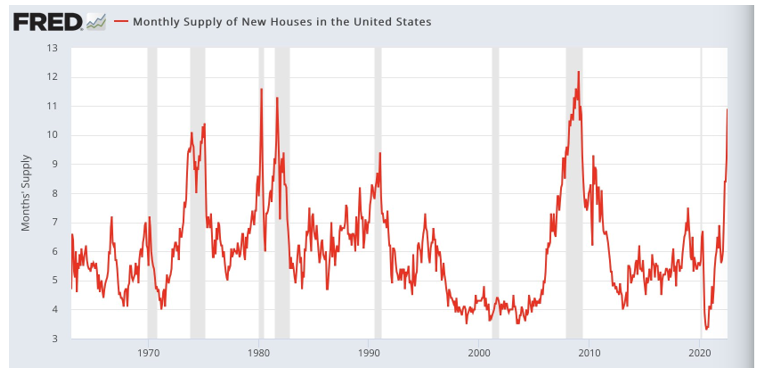
Source: Federal Reserve Bank of St. Louis
Should a recession materialize, we wouldn’t expect downturn to cascade into calamity. In addition to an extremely low unemployment rate, pandemic cash stimulus programs and huge run-ups in home equity have left household balance sheets in good shape.
Asset Class & Sector Survey
As we consider the business school professor’s formula for higher stock prices (higher cash flows or lower discount rates), we aren’t particularly constructive over the short term. Recessions always weigh on corporate cash flows, and there’s strong reason to think that one is looming on the horizon.
Furthermore, companies have been clearing very high profit margin hurdles since the pandemic began, but that is unlikely to continue indefinitely. Profit margins peaked at 12.6% at the end of 2021 and have been declining for five straight quarters. (FactSet reported Q3 margins of 12% for S&P 500 companies.) Excluding the energy sector, Q3 earnings decreased 3.5%, according to Bloomberg Intelligence. Return on equity metrics are at the top of their historical range and much higher than they were before the pandemic.
As to the odds of seeing lower short-term interest rates in the near future, we are rather skeptical. In their meeting minutes from their December policy meeting, Fed officials stressed the need to maintain a “restrictive policy stance” until data could give them confidence that inflation pressures are easing. Academic research indicates that the higher interest rates can take more than two years to meaningfully reduce inflation in advanced economies.
Although we are likely to see 5% short-term rates in 2023, we’d be surprised to see 10-year Treasury yields to venture north of 4% for very long; they did for about four weeks during October and November. Five and 10-year “breakeven inflation” rates are 2.25%, so bond investors are now able to earn a return above projected inflation.
There is another, more practical reason that intermediate and long-term rates are likely to stay below 4%: mushrooming federal debt. While the Federal Reserve’s mandate does not officially include suppressing the Treasury’s borrowing costs, it has historically found itself with that unofficial mandate for long periods of time (notably during World War II and the Korean War).
When the Fed last launched an aggressive anti-inflation campaign (in the early 1980’s), it did so when federal debt was about 30% of GDP. Today, that number is around 125%. With a $31 trillion debt balance, the Treasury Department currently spends about $500 billion annually in net interest payments. But as federal debt climbs and old Treasury bonds are replaced with new ones with higher interest rates, annual interest payments will climb into the $1 trillion range by 2033.
Given that the Fed is still in tightening mode and investors aren’t picking up much (if any) additional yield for bonds maturing in more than five years, we certainly wouldn’t recommend purchasing bonds with maturities north of seven to 10 years.
Notwithstanding the 2022 selloff, stocks aren’t particularly cheap. And with a recession looming, we’d advise keeping stock allocations at long-term strategic weightings for the time being. When corporate earnings start to meaningfully decline and the Fed actually begins to pivot, then put more chips on the stock market table.
Please reach out to us if you’d like to discuss capital markets or your personal financial plan.
 Teancum D. Light, JD, CPA, CFP®
President
tlight@lighthousewealth.com

Chief Investment Officer
jadams@lighthousewealth.com
Disclosures: This material is for informational purposes only and is not rendering or offering to render personalized investment advice or financial planning. This is neither a solicitation nor a recommendation to purchase or sell an investment and should not be relied upon as such. Before taking any action, you should always seek the assistance of a professional who knows your particular situation for advice on taxes, your investments, the law or any other matters that affect you or your business. Although Lighthouse Wealth Management has made every reasonable effort to ensure that the information provided is accurate, Lighthouse Wealth Management makes no warranties, expressed or implied, on the information provided. The reader assumes all responsibility for the use of such information.