Download a PDF copy of the Lighthouse Wealth Outlook here: Lighthouse Wealth Outlook – July 2022.
On Wednesday, July 13, the U.S. Bureau of Labor Statistics reported that the Consumer Price Index (CPI) rose by 9.1% from the previous year, marking the fastest pace for inflation going back to November of 1981.[1] Sources for the increase were widespread, with food up 10.4%, shelter costs up 5.6% and electricity prices up 13.7%. Energy prices were up a massive 41.6%.[2]
Unfortunately for American workers, compensation is failing to keep up with the increased costs. Adjusted for inflation, workers’ hourly wages fell 1% during June and are down 3.6% from a year ago.[3]
Blame for the inflation has been attributed to numerous sources, including residual supply chain issues from COVID-19 disruptions and the Russian invasion of Ukraine,[4] although price levels were already moving higher before then. Other politicians have cited “corporate greed,” calling on energy companies to pay windfall taxes.[5]
As we read these economic data points and attendant political responses, we can’t help but recall “Free to Choose,” co-written by Nobel Prize-winning economist Milton Friedman and his wife, Rose. The book was published in 1980, in conjunction with an eponymous ten-part television series which aired on PBS. As we are today, the United States was also enduring lofty inflation rates at that time—albeit with much higher unemployment levels.
The ninth chapter of “Free to Choose” entitled “The Cure for Inflation,” makes the following claim: “To our knowledge there is no example in history of a substantial inflation that lasted for more than a brief time that was not accompanied by a roughly correspondingly rapid increase in the quantity of money; and no example of a rapid increase in the quantity of money that was not accompanied by a roughly correspondingly substantial inflation.”
The authors then offer a series of charts depicting the high correlation between the changes in quantity of money per unit of economic output and changes in consumer price index, for five different countries.
Fast forward 40 years.
As the Federal Reserve purchased the new Treasury debt used to fund COVID related relief programs, the U.S. money supply ballooned a cumulative 40% in 2021 and 2022. After a lag of several months, inflation inevitably followed.
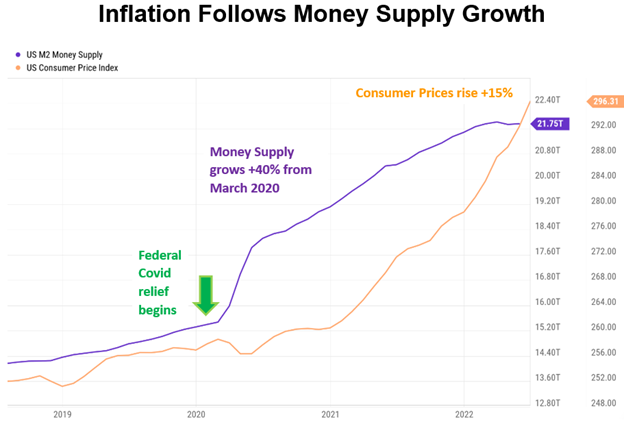
Source: YCharts. Retrieved July 18, 2022.
Beyond diagnosing inflation, “Free to Choose” also offers a cure: a reduction in the rate of monetary growth. The Friedmans include the caveat that “an interim period of slow economic growth and higher than usual unemployment” are the painful side effects.
Under the stewardship of Chairman Paul Volcker, the Federal Reserve followed the “Free to Choose” prescription in the early 1980’s. In an effort to stem money supply growth, short-term interest rates were raised substantially, peaking at more than 22% in 1981. A recession followed the summer of 1981, with unemployment hitting 10.8% at its tail end in November of 1982. By that time, inflation had declined below 5%, where it remained until 1989. Current Federal Reserve Chairman Jerome Powell has recently taken a page from the Paul Volcker playbook, raising short-term rates by 0.75% on June 15, the largest single hike since 1994. Chairman Powell has since indicated that the Federal Reserve will keep raising rates until it sees “compelling evidence” that inflation is decreasing.[6]
In the wake of June inflation numbers, markets are assigning a two-thirds chance that the Federal Reserve will raise its target rate by 1% on July 27, which would place it in the 2.50%-2.75% range.[7] However, today’s 3.15% yield on the two-year Treasury note suggests that the Federal Reserve will not venture much above the 3% level by the time its rate-increase cycle has ended.[8]
Even though the market currently anticipates short-term rates topping out around 3%, expected inflation rates have declined considerably since late March. Over the next five years, Treasury bond markets are forecasting annual inflation in the 2.5% range.[9]
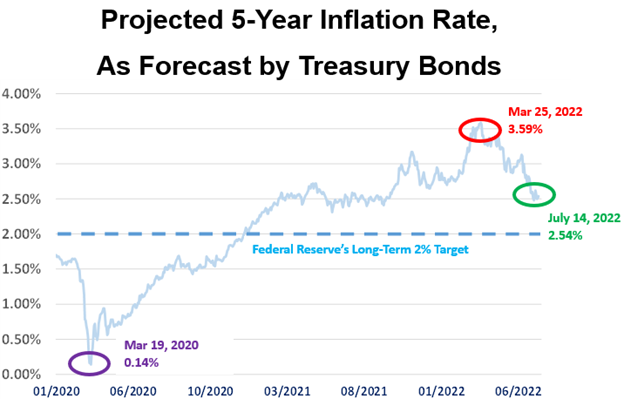
Source: YCharts. Retrieved July 18, 2022.
While it’s possible that the Federal Reserve’s aggressive turn will not push inflation below 5% before the end of 2022 (or even mid-2023), we perceive the recent leveling off in the money supply as a positive indication that long-term inflation rates will fall materially from today’s elevated levels i.e. the pace of consumer price increases should decrease; the prices themselves aren’t likely to fall back to 2020 levels.
June surveys of five of the 12 district Federal Reserve Banks provide additional evidence that inflation may be declining, thanks to fewer supply chain disruptions. Delivery times and order backlogs—which have a tight correlation with inflation rates—have both begun to decline.[10]
ECONOMIC CONDITIONS
Real gross domestic product decreased by 1.6% in the first quarter of 2022.[11] Although second quarter GDP data will not be released until July 28, the Atlanta Fed’s model is now projecting Q2 GDP of negative 2.1%.[12] The implication of two such consecutive quarters of negative GDP growth is that the U.S. is likely already in a recession. (In our April 2022 installment of this newsletter, we projected that a recession would occur in the next 6-24 months.)
The University of Michigan’s Surveys of Consumers reached its lowest-ever level in June since the university started collecting consumer sentiment data nearly 70 years ago. About 79% of consumers expected bad times in the year ahead for business conditions, the highest since 2009. The survey showed 47% of consumers blamed inflation for eroding their living standards. Consumers expect inflation to run at a rate of 3.1% for the next five years.[13]
Despite the recessionary outlook, the job market remains very strong. The unemployment rate was only 3.6% in June, with 1.9 job openings for every one job seeker.
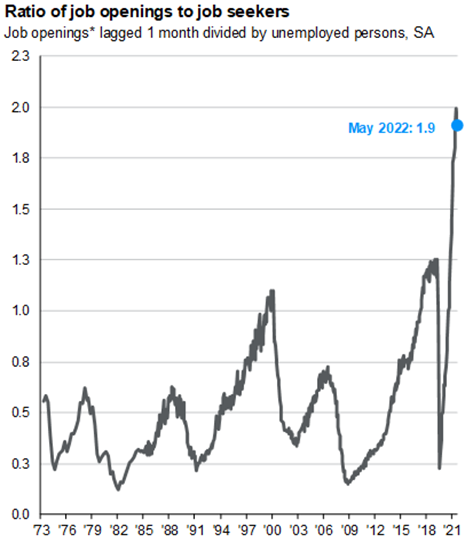
Source: am.jpmorgan.com/us/en/asset-management/protected/adv/insights/market-insights/guide-to-the-markets/. Retrieved July 18, 2022.
The continued labor market tightness should provide Chairman Powell ample leeway to stabilize prices via additional interest rate hikes without running into difficulty with the Federal Reserve’s other mandate of promoting maximum employment.
FINANCIAL MARKET REVIEW
The S&P 500 finished the first half of 2022 down 20%, its worst first half since 1962. International shares slumped by a comparable amount. The Barclays U.S. Aggregate Bond Index was down 10% in the first half of 2022, its lowest start to a year.[14] (As noted in our April newsletter, we had been advising extreme caution on bonds for over a year.)
The U.S. dollar was up against all major currencies through June. Notably, it is now trading at parity with the euro—for the first time in 20 years. Notwithstanding its proponents’ claims that cryptocurrency provides a meaningful hedge against rising inflation and/or a dollar implosion, Bitcoin managed to lose 57% of its value in the first half of 2022, dropping 37% in the month of June alone. (Its peer, Ethereum, plummeted 70% and 43%, respectively, over comparable horizons.)[15]
As stocks, bonds and cryptocurrencies cratered, commodities and real estate—the “classic inflation hedges”—have enjoyed a good year so far. Despite a 14% decrease from its early June highs, the Bloomberg Commodity Index is still up 18% for the year as petroleum, grain and gold prices climbed.[16] The national year-over-year change in median asking rent was up 14.1% through June.[17] The S&P CoreLogic Case-Shiller U.S. National Home Price Index rose 20.4% year-over-year in April.[18] However, recent reports have indicated that rising mortgage rates have finally begun to weigh on home asking prices.[19]
MARKET OUTLOOK
Even if inflation does ease back into the 2-2.5% range, savers still face a rather unfavorable environment. A 3% return on a savings or money market account will only generate an after-tax return of 2.25% for taxpayers in a 22% federal and 3% state income bracket, which is still below the current inflation rate. Accordingly, we continue to recommend that even the most conservative investors maintain at least a 40% long-term allocation to asset classes that benefit from modest levels of inflation, namely, equities and real estate.
As well as growing consumer discontent, inflation has also begun to weigh on corporate bottom lines. Both Walmart and Target shares plunged in May as higher input costs squeezed their margins and sales of consumer discretionary items slowed considerably. While store traffic has been solid, consumers have been focused on essentials.[20]
Stock prices are finally starting to appear slightly cheap versus company earnings, but our impression is that many 2022 earnings estimates may not have sufficiently accounted for inflationary and recessionary effects. With that said, we believe that now is a good entry point into value stocks, particularly mid- and small-cap value shares.
The Treasury yield curve is flat for bonds maturing in more than two years. Intermediate- and long-term bonds are offering insufficient compensation, especially as the Federal Reserve has not yet corralled inflation. However, with a yield to maturity of 3.5%,[21] short-term investment-grade corporate bonds warrant a serious look.
While 2022 has not been especially pleasant for investors, it is presenting opportunities for tax planning. Roth IRA conversions and tax-loss harvesting are two strategies worth exploring. Please reach out to Jimmy Adams, Private Wealth Advisor at Lighthouse Wealth, if you’d like to discuss your personal financial plan.
Disclosures: This material is for informational purposes only and is not rendering or offering to render personalized investment advice or financial planning. This is neither a solicitation nor a recommendation to purchase or sell an investment and should not be relied upon as such. Before taking any action, you should always seek the assistance of a professional who knows your particular situation for advice on taxes, your investments, the law or any other matters that affect you or your business. Although Lighthouse Wealth has made every reasonable effort to ensure that the information provided is accurate, Lighthouse Wealth makes no warranties, expressed or implied, on the information provided. The reader assumes all responsibility for the use of such information.
[1] cnbc.com/2022/07/13/inflation-rose-9point1percent-in-june-even-more-than-expected-as-price-pressures-intensify.html
[2] www.bls.gov/news.release/cpi.nr0.htm
[3] www.bls.gov/news.release/realer.nr0.htm
[4] www.whitehouse.gov/briefing-room/statements-releases/2022/06/10/statement-by-president-biden-on-consumer-price-index-cpi-in-may/
[5] bloomberg.com/news/articles/2022-05-19/-greedflation-pits-democrats-against-like-minded-economists#xj4y7vzkg
[6] www.theguardian.com/business/2022/jun/22/fed-raising-rates-compelling-evidence-lowering-inflation-jerome-powell
[7] www.marketwatch.com/story/fed-funds-futures-now-show-67-chance-fed-raises-fed-funds-rate-target-by-100-basis-points-in-july-2022-07-13
[8] YCharts. Retrieved July 18, 2022.
[9] ibid
[10] finance.yahoo.com/news/morning-brief-july-1-2022-100006640.html
[11] www.bea.gov/data/gdp/gross-domestic-product
[12] www.atlantafed.org/cqer/research/gdpnow
[13] www.cnn.com/2022/06/28/economy/consumer-confidence-index-june/index.html
[14] YCharts. Retrieved July 18, 2022.
[15] ibid
[16] ibid
[17] www.redfin.com/news/redfin-rental-report-june-2022
[18] www.zillow.com/research/april-2022-case-shiller-31215/
[19] www.cnbc.com/2022/07/14/these-are-the-10-cities-seeing-the-most-price-cuts-for-homes.html
[20] www.barrons.com/articles/target-stock-price-inventory-profit-outlook-51654600838
[21] YCharts. Retrieved July 18, 2022.