Download the PDF Version of the Lighthouse Wealth Market Outlook: April 2021
ECONOMIC CONDITIONS
The U.S. economy grew at an annual rate of 4.3% in the last three months of 2020[1], slightly faster than previously estimated. For all of 2020, U.S. Gross Domestic Product (GDP) fell 3.5%[2], the largest annual decline since 1946, when the economy demobilized after World War II.
The recent strength is expected to accelerate as the $1.9 trillion stimulus from the American Rescue Plan Act hits consumers in the form of stimulus payments, larger unemployment benefits, and rental assistance. The New York Fed Staff Nowcast and the Atlanta Federal Reserve GDPNow tool are predicting GDP gains of 6%[3] and 5%[4], respectively, for the first quarter of 2021.
For the full year 2021, the Federal Reserve’s Federal Open Market Committee (FOMC) is predicting torrid growth of 6.5%, before cooling off towards longer-term averages in 2022 and 2023[5]. Along with the increase in GDP, committee members forecast unemployment to fall from its current 6.2% level to 4.5%[6].
A portion of this year’s anticipated growth derives from the President’s planned $2.25 trillion infrastructure spending on bridges, railways, and clean energy initiatives. To partially foot the bill, the administration is proposing higher taxes on corporations and high-income earners. Capital gains taxes may also increase materially for those with annual income exceeding $1 million[7].
Regardless of how much higher tax rates may add to federal coffers, the government is likely to borrow at least $4 trillion this year[8]. (The most recent Congressional Budget Office projections were $2.3 trillion before considering the recent $1.9 trillion stimulus[9].)
FINANCIAL MARKET CONDITIONS
Three months ago, we noted that the Federal Reserve was very likely to keep short-term rates on hold through 2021. We also noted the “extremely low” level of bond yields and the corresponding “high risk for longer maturity bonds.” Consequently, we recommended avoiding them.
We did not expect to be vindicated so quickly.
The Bloomberg Barclays U.S. Aggregate Bond Index posted a loss of 3.37% in the first quarter.[10] To put that abysmal performance in context, the worst calendar year for the index in its 45-year history was a loss of 2.92% in 1994[11].
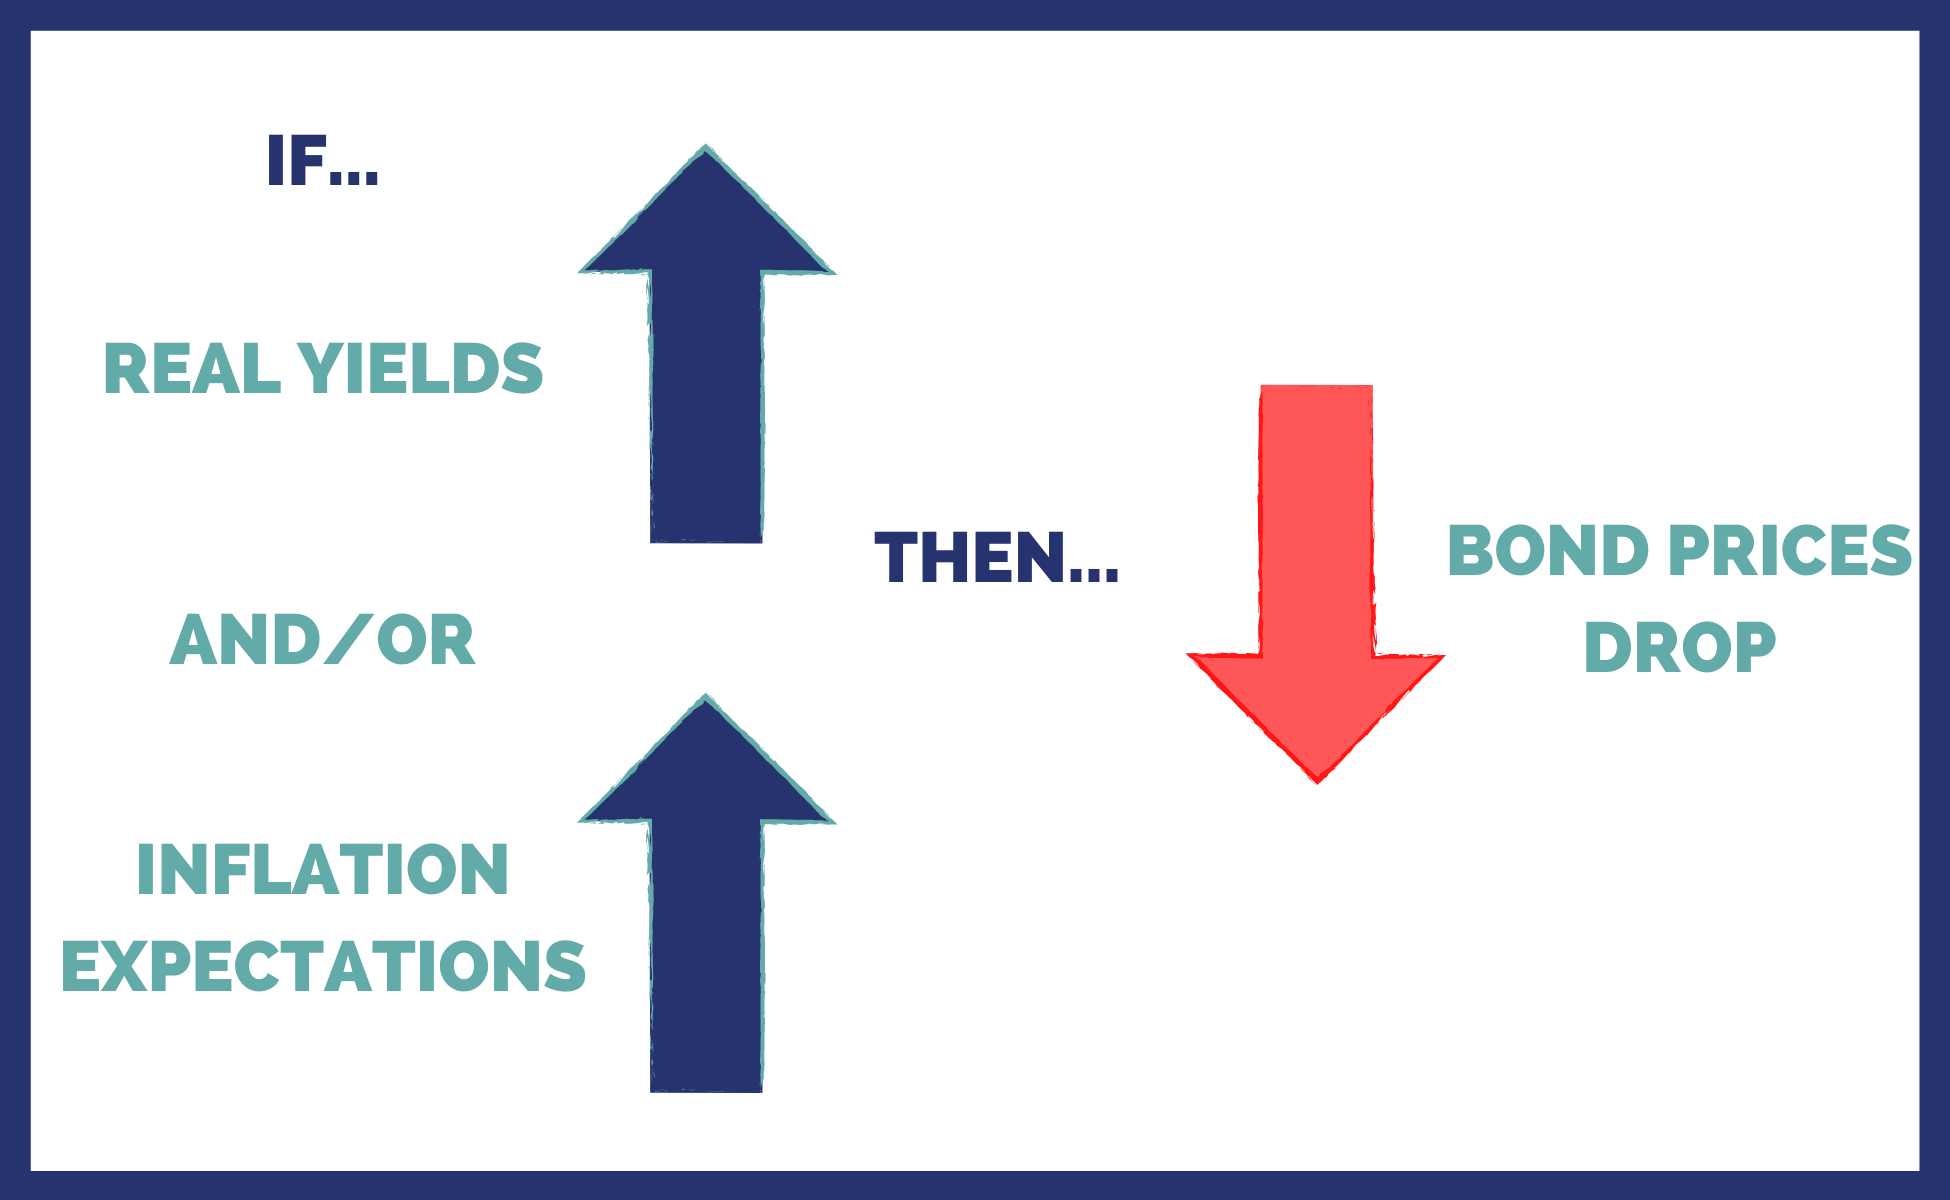
Bond yields are often described as consisting of two components: a “real yield” plus an imputed inflation rate. That is, a nominal bond yield of 3% might consist of a real yield of 1% + 2% expected annual inflation over the life of the bond. The 1% is said to be the “real return” after factoring for inflation costs.
Whenever real yields or expected inflation rise, most bond prices fall as a result. (There are two noteworthy exceptions: 1) Floating-rate bonds benefit from rising short-term interest rates; 2) Treasury Inflation-Protected Securities (TIPS) incur principal adjustments when inflation rises.)
In the second quarter, bond prices were severely pressured by both the “real yield” and “inflation” factors. Real yields on 10-year TIPS rose by 0.43%[12], while inflation expectations on 10-year Treasury bonds rose by 0.38%[13]. The resulting spike in yields drove Treasury bond prices markedly lower. A holder of an on-the-run 10-year Treasury bond lost over 7% in the first quarter, while owners of 30-year Treasury bonds lost more than 15% in just three months![14]
Notwithstanding the recent spike, real yields remain firmly in negative territory (about -0.60% on 10-year TIPS[15]) as they have since last March. Given Federal Reserve Chairman Jerome Powell’s professed “for as long as it takes” stance on providing accommodating monetary policy through the COIVD crisis, it isn’t particularly surprising to see real yields negative, despite the raft of Treasury bond issuance.
In our view, the much more startling development is the dramatic rise in inflation expectations. On March 17, the Fed projected inflation running to 2.4% this year[16], well above its December estimate of 1.8%[17]. More jarring, though, is the bond market’s forecast that the higher inflation will persist well beyond 2021.
The “breakeven inflation” rate on 10-year Treasury bonds versus TIPS is now at 2.3%—its highest level since summer 2013[18]. Meanwhile, five-year Treasury and TIPS are signaling average annual inflation of 2.5% over the next five years[19]. Five-year breakeven inflation hasn’t been this high since the Global Financial Crisis began to accelerate in the summer of 2008[20].
Anticipated 5-Year Annual Inflation Rate, as Implied by TIPS Prices
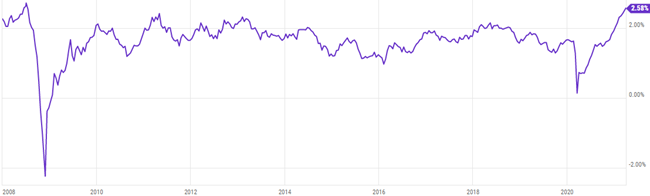
Source: YCharts
Historically, higher anticipated inflation would be met with expectations for a commensurate rise in expected short-term interest rates. But in its most recent minutes, only four of the 18 FOMC members were looking for a rate hike at some point in 2022. And only two members expect the target fed funds rate to be north of 1% by 2023[21]. The bond market is currently pricing in a short-term rate of 0.75% by the end of 2023[22].
If the bond market’s inflation and FOMC’s interest rate forecasts are both correct, checking and savings account holders should expect to lose 7-8% of their purchasing power with almost no interest to show for it over the next three years[23].
Notwithstanding the rise in inflation expectations, gold—which is often described as a long-term inflation hedge—saw its price decline by 10% during the first quarter[24]. What is often omitted from the yellow metal’s story: gold prices are also sensitive to real yields. As real yields rise, the gold price tends to fall because it makes bonds more attractive as an alternative. However, as long as real yields remain negative, gold prices have decent fundamental support.
While bonds and gold were down in the first quarter, equities were largely up across the board with the S&P 500 Index up 6.2%. After years of underperformance versus growth companies, value stocks finally beat them in Q1—by 10%, the largest performance margin in 20 years! U.S. small cap value stocks posted a nearly 13% return, with small cap value up more than +21%. Large value stocks also fared well and gained almost +11% on average.
Despite the 6% price increase since December 31, the stocks comprising the S&P 500 are still trading at the same 12-month forward price-to-earnings estimates as they were three months ago (about 22x). This is largely a consequence of upward revisions in earnings estimates, as fiscal stimulus and vaccine rollout have surpassed expectations[25].
PORTFOLIO POSITIONING
If it’s a rather overused expression, it’s still a valid one: “Don’t fight the Fed!”
Between interest rate policy and the push for inflation above 2%, Federal Reserve Chairman Powell has signaled (although not stated) that bondholders and bank account owners are very likely to be the collateral damage in the Fed’s war on unemployment. That is, any interest earned on their bonds is likely to be entirely consumed by the tax of inflation—to say nothing of actual income taxes!
“Real Yield” on 5-Year TIPS
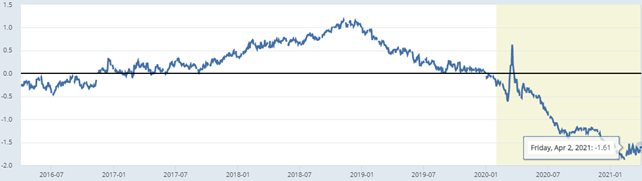
Source: Federal Reserve Bank of St. Louis.
The Biden Administration is pushing for higher tax rates on corporations and high-income earners, which would weigh on stock prices at the margin. However, we believe that any adverse stock market effects from tax policy changes would be largely mitigated by the outlays associated with the proposed infrastructure spending. In short, bigger deficit spending eventually translates into bigger corporate profits.
Given an environment of lofty stock valuations, higher inflation expectations, and anemic bond yields, conservative investors (particularly retirees) should consider lower volatility stocks (e.g., utilities and consumer staples) for both income generation and inflation protection.
If you would care to discuss any of the above topics and how they might apply to your financial plan, please don’t hesitate to reach out to me.
Disclosures: This material is for informational purposes only and is not rendering or offering to render personalized investment advice or financial planning. This is neither a solicitation nor a recommendation to purchase or sell an investment and should not be relied upon as such. Before taking any action, you should always seek the assistance of a professional who knows your particular situation for advice on taxes, your investments, the law or any other matters that affect you or your business. Although Lighthouse Wealth has made every reasonable effort to ensure that the information provided is accurate, Lighthouse Wealth makes no warranties, expressed or implied, on the information provided. The reader assumes all responsibility for the use of such information.
[1] ttnews.com/articles/government-revises-q4-gdp-slightly-43. Retrieved March 29, 2021.
[2] Ibid
[3] www.newyorkfed.org/research/policy/nowcast. Retrieved March 29, 2021.
[4] www.frbatlanta.org/cqer/research/gdpnow. Retrieved March 29, 2021.
[5] www.federalreserve.gov/monetarypolicy/files/fomcprojtabl20210317.pdf. Retrieved March 29, 2021.
[6] Ibid
[7] https://www.cnn.com/2021/03/18/politics/biden-tax-plan-explainer/index.html. Retrieved March 29, 2021.
[8] www.cnbc.com/2021/02/11/deficit-projected-at-2point3-trillion-for-2021-not-counting-additional-stimulus-cbo-says.html. Retrieved March 29, 2021.
[9] Ibid
[10] YCharts.com. Retrieved April 2, 2021.
[11] Ibid
[12] Ibid
[13] Ibid
[14] Calculation by author.
[15] YCharts. Retrieved April 1, 2021.
[16] www.federalreserve.gov/monetarypolicy/files/fomcprojtabl20210317.pdf. Retrieved March 29, 2021.
[17] https://www.federalreserve.gov/monetarypolicy/fomcprojtabl20201216.htm. Retrieved March 29, 2021.
[18] YCharts. Retrieved April 1, 2021.
[19] Ibid
[20] Ibid
[21] www.federalreserve.gov/monetarypolicy/files/fomcprojtabl20210317.pdf. Retrieved March 29, 2021.
[22] YCharts. Retrieved April 1, 2021.
[23] Calculation by author.
[24] YCharts. Retrieved April 2, 2021.
[25] Ibid